John Salvatier forwards a note from Anand Patil that a paper on PyMC has appeared in the Journal of Statistical Software, We'll have to check this out.
9
There are more charts in Demography and Growth report by the Reserve Bank of Australia:
Unfortunately for Dent, there was the 2001 dip before the 2008 drop.
The phrase "virtual lobsters" is kinda nice, I think. But check out the seemingly gratuitous mention of Bayesian statistics. There's just no way the intended audience for this article is expected to know what Bayesian statistics is --- unlike "v-notching protection", which is mentioned elsewhere but the article doesn't bother to explain because, hey, everybody knows what v-notching protection is.
Two percent of the top 50, that's one person. And 2.5 percent of the top 200, that's five people. As a general rule, when the numerator in count data is very small, or when the denominator is fairly small, I prefer to see the numerator and denominator separately rather than a percentage. If someone says "this guy has been making more than 80% of his free throws this post season," I want to know if that is 6/7 or 17/20. So I think they should say 1/50 and 5/200, rather than 2% of the top 50 and 2.5% of the top 200. Yes, I understand these are mathematically identical, but I betcha a lot of people see "2% of 50" and don't realize that's one person, even though they'd realize it if they thought about it for just a second.
Results matching “R”
I. State of the Climate report
The National Oceanic and Atmospheric Administration recently released their "State of the Climate Report" for 2009. The report has chapters discussing global climate (temperatures, water vapor, cloudiness, alpine glaciers,...); oceans (ocean heat content, sea level, sea surface temperatures, etc.); the arctic (sea ice extent, permafrost, vegetation, and so on); Antarctica (weather observations, sea ice extent,...), and regional climates.
NOAA also provides a nice page that lets you display any of 11 relevant time-series datasets (land-surface air temperature, sea level, ocean heat content, September arctic sea-ice extent, sea-surface temperature, northern hemisphere snow cover, specific humidity, glacier mass balance, marine air temperature, tropospheric temperature, and stratospheric temperature). Each of the plots overlays data from several databases (not necessarily indepenedent of each other), and you can select which ones to include or leave out.
News flash: the earth's atmosphere and oceans are warming rapidly.
By the way, note that one of the temperature series -- Stratospheric (high-altitude) temperature -- is declining rather than increasing. That's to be expected since the stratosphere is getting less heat from below than it used to: more of the heat coming from the earth is absorbed by the CO2 in the lower atmosphere.
II. 35th Anniversary of a major global warming prediction
Another recent news item is the "celebration" of the 35th anniversary of the very brief article, in the journal Science, "Climatic Change: Are We on the Brink of Pronounced Global Warming", by Wallace Broecker. When the paper was published (1975) the global mean temperature was only about 0.2 C higher than it had been in 1900, and the trend was downward rather than upward. Broeker correctly predicted that the downward trend would end soon, and that the ensuing warming would "by the year 2000 bring average global temperatures beyond the range experienced in the last 1000 years." He got that right, or at least, the highly uncertain temperature data from 1000 years ago are consistent with Broeker having gotten that right. If he was wrong, it was only by a decade or so.
III. Not really news, but since we're here...
Speaking of global temperatures 1000 years ago, one thing anthropogenic climate change skeptics like to point out is that wine was produced in England in the year 1000, and the Norse on Greenland were able to graze cattle and produce crops. True! It's also true that you can visit vineyards in England today, and if you're in Greenland, don't forget to try the local mutton or beef.
IV. No climate bill again this year
Meanwhile, Congress has dropped efforts to reduce greenhouse gas emissions.
One can quibble about the best way to display county-level unemployment data on a map, since a small, populous county gets much less visual weight than a large, sparsely populated one. Even so, I think we can agree that this animated map by LaToya Egwuekwe is pretty cool. It says it shows the unemployment rate by county, as a function of time, but anyone with even the slightest knowledge of what happens during a zombie attack will recognize it for what it is.
Michael Gilligan, Eric Mvukiyehe, and Cyrus Samii write:
We [Gilligan, Mvukiyehe, and Samii] use original survey data, collected in Burundi in the summer of 2007, to show that a World Bank ex-combatant reintegration program implemented after Burundi's civil war caused significant economic reintegration for its beneficiaries but that this economic reintegration did not translate into greater political and social reintegration.Previous studies of reintegration programs have found them to be ineffective, but these studies have suffered from selection bias: only ex-combatants who self selected into those programs were studied. We avoid such bias with a quasi-experimental research design made possible by an exogenous bureaucratic failure in the implementation of program. One of the World Bank's implementing partners delayed implementation by almost a year due to an unforeseen contract dispute. As a result, roughly a third of ex-combatants had their program benefits withheld for reasons unrelated to their reintegration prospects. We conducted our survey during this period, constructing a control group from those unfortunate ex-combatants whose benefits were withheld.
We find that the program provided a significant income boost, resulting in a 20 to 35 percentage point reduction in poverty incidence among ex-combatants. We also find moderate improvement in ex-combatants' livelihood prospects.
However, these economic effects do not seem to have caused greater political integration. While we find a modest increase in the propensity to report that civilian life is preferable to combatant life, we find no evidence that the program contributed to more satisfaction with the peace process or a more positive disposition toward current government institutions.
Reintegration programs are central in current peace processes and considerable resources are devoted to them. Thus, our evidence has important policy implications. While we find strong evidence for the effectiveness in terms of economic reintegration, our results challenge theories stating that short-run economic conditions are a major determinant of one's disposition toward society and the state.
Social and political integration of ex-combatants likely requires much more than individually-targeted economic assistance.
This seems important for policy and I hope will get some attention. Form a statistical perspective, they use a cool identification strategy: As noted in the abstract above, they take advantage of a bureaucratic failure. The paper uses matching to handle "incidental" imbalances, inverse propensity adjustment for "exposure heterogeneity", and graphs estimates in terms of population level effects (rather than in terms of individual level effects, which current causal inference literature never take to be identified).
Don't trust anyone who refers to gambling as "gaming."
Washington Post and Slate reporter Anne Applebaum wrote a dismissive column about Wikileaks, saying that they "offer nothing more than raw data."
Applebaum argues that "The notion that the Internet can replace traditional news-gathering has just been revealed to be a myth. . . . without more journalism, more investigation, more work, these documents just don't matter that much."
Fine. But don't undervalue the role of mere data! The usual story is that we don't get to see the raw data underlying newspaper stories. Wikileaks and other crowdsourced data can be extremely useful, whether or not they replace "traditional news-gathering."
What can we learn about an author from his or her fiction? This is an old, old question, I know. But I still can't help thinking about it when I read a book.
John Updike's stories are full of male characters whom women find irresistibly attractive. I can only assume that this reflects Updike's own experiences, to some extent. If he had not been, in reality, catnip to women, I imagine he'd have made more of a big deal about the episodes in his books where women kept falling into his protagonists' laps.
Same for John D. Macdonald, although there I suppose it's possible he was just throwing in the sex to sell books.
And even more so for Richard Ford. This guy's male characters are so smooth, there's no way that Ford isn't/wasn't like that too.
What about Lorrie Moore? I think she must have had a very frustrating life (so far). I say this because her stories always seem to be centered around a female character who is witty, thoughtful, and refined, and surrounded by really piggy guys.
And I can only assume that Franz Kafka had some frustrating experiences in his life as well.
Other writers seem tougher to characterize. For example, Jane Smiley's characters are all over the place, as are J. Robert Lennon's. I can't see how I could draw many conclusions about their personal experiences from their books. Lots and lots of writers are like this: you get a sense of their sensibilities but not really of their experiences. Maybe that's why cases such as John Updike and Lorrie Moore are so interesting, that they seem to be revealing, perhaps unintentionally, bits of themselves?
Regarding editing: The only serious editing I've ever received has been for my New York Times op-eds and my article in the American Scientist. My book editors have all been nice people, and they've helped me with many things (including suggestions of what my priorities should be in communicating with readers)--they've been great--but they've not given (nor have I expected or asked for) serious editing. Maybe I should've asked for it, I don't know. I've had time-wasting experiences with copy editors and a particularly annoying experience with a production editor (who was so difficult that my coauthors and I actually contacted our agent and a lawyer about the possibility of getting out of our contract), but that's another story.
Regarding clutch hitting, Bill James once noted that it's great when a Bucky Dent hits an unexpected home run, but what's really special is being able to get the big hit when it's expected of you. The best players can do their best every time they come to the plate. That's why Bill James says that the lack of evidence for clutch hitting makes sense, it's not a paradox at all: One characteristic of pros is that they can do it over and over.
Panos Ipeirotis writes in his blog post:
Everyone who has attended a conference knows that the quality of the talks is very uneven. There are talks that are highly engaging, entertaining, and describe nicely the research challenges and solutions. And there are talks that are a waste of time. Either the presenter cannot present clearly, or the presented content is impossible to digest within the time frame of the presentation.We already have reviewing for the written part. The program committee examines the quality of the written paper and vouch for its technical content. However, by looking at a paper it is impossible to know how nicely it can be presented. Perhaps the seemingly solid but boring paper can be a very entertaining presentation. Or an excellent paper may be written by a horrible presenter.
Why not having a second round of reviewing, where the authors of accepted papers submit their presentations (slides and a YouTube video) for presentation to the conference. The paper will be accepted and be included in the proceedings anyway but having a paper does not mean that the author gets a slot for an oral presentation.
Under an oral presentation peer review, a committee looks at the presentation, votes on accept/reject and potentially provides feedback to the presenter. The best presentations get a slot on the conference program.
While I've enjoyed quiet time for meditation during boring talks, this is a very interesting idea - cost permitting. As the cost of producing a paper and a presentation to pass peer review goes into weeks, a lot of super-interesting early-stage research just moves off the radar.
From a commenter on the web, 21 May 2010:
Tampa Bay: Playing .732 ball in the toughest division in baseball, wiped their feet on NY twice. If they sweep Houston, which seems pretty likely, they will be at .750, which I [the commenter] have never heard of.
At the time of that posting, the Rays were 30-11. Quick calculation: if a team is good enough to be expected to win 100 games, that is, Pr(win) = 100/162 = .617, then there's a 5% chance that they'll have won at least 30 of their first 41 games. That's a calculation based on simple probability theory of independent events, which isn't quite right here but will get you close and is a good way to train one's intuition, I think.
Having a .732 record after 41 games is not unheard-of. The Detroit Tigers won 35 of their first 40 games in 1984: that's .875. (I happen to remember that fast start, having been an Orioles fan at the time.)
Now on to the key ideas
The passage quoted above illustrates three statistical fallacies which I believe are common but are not often discussed:
1. Conditioning on the extrapolation. "If they sweep Houston . . ." The relevant data were that the Rays were .732, not .750.
2. Counting data twice: "Playing .732 . . . wiped their feet on NY twice." Beating the Yankees is part of how they got to .732 in the first place.
3. Remembered historical evidence: "at .750, which I have never heard of." There's no particular reason the commenter should've heard of the 1894 Tigers; my point here is that past data aren't always as you remember them.
P.S. I don't mean to pick on the above commenter, who I'm sure was just posting some idle thoughts. In some ways, though, perhaps these low-priority remarks are the best windows into our implicit thinking.
P.P.S. Yes, I realize this is out of date--the perils of lagged blog posting. But the general statistical principles are still valid.
"Ich glaube, dass die Wahrscheinlichkeitsrechnung das richtige Werkzeug zum Lösen solcher Probleme ist", sagt Andrew Gelman, Statistikprofessor von der Columbia-Universität in New York. Wie oft aber derart knifflige Aufgaben im realen Leben auftauchen, könne er nicht sagen. Was fast schon beruhigend klingt.
Responding to journalist Elizabeth Kolbert's negative review of Freakonomics 2 in the New Yorker, Stephen Dubner writes, that, although they do not have any training in climate science, it's also the case that:
Neither of us [Levitt and Dubner] were Ku Klux Klan members either, or sumo wrestlers or Realtors or abortion providers or schoolteachers or even pimps. And yet somehow we managed to write about all that without any horse dung (well, not much at least) flying our way.
But Levitt is a schoolteacher (at the University of Chicago)! And, of course, you don't have to be a sumo wrestler to be (some kind of an) expert on sumo wrestling, nor do you have to teach in the K-12 system to be an expert in education, nor do you have to provide abortions to be an expert on abortion, etc. And Levitt has had quite a bit of horse dung thrown at him for the abortion research. The connection is that abortion and climate change matter to a lot of people, while sumo wrestling and pimps and teachers who cheat are more like feature-story material.
Continue reading When is expertise relevant?.
Faithful readers will know that my ideal alternative career is to be an editor in the Max Perkins mold. If not that, I think I'd enjoy being a literary essayist, someone like Alfred Kazin or Edmund Wilson or Louis Menand, who could write about my favorite authors and books in a forum where others would read and discuss what I wrote. I could occasionally collect my articles into books, and so on. On the other hand, if I actually had such a career, I wouldn't have much of an option to do statistical research in my spare time, so I think for my own broader goals, I've gotten hold of the right side of the stick.
As it is, I enjoy writing about literary matters but it never quite seems worth spending the time to do it right. (And, stepping outside myself, I realize that I have a lot more to offer the world as a statistician than literary critic. Criticism is like musicianship--it can be hard to do, and it's impressive when done well, but a lot of people can do it. Literary criticism is not like statistics. The supply of qualified critics vastly exceeds demand. Nobody is going to pay me $x/hour to be a literary consultant (for good reason, I'm sure), for any positive value of x. 9999 readers, Aleks,...
So you get it for free.
Anyway, this is all preamble to a comment on Clive James, who I just love--yes, I realize this marks me as a middlebrow American Anglophile. Deal with it. In any case, I came across this footnote in his verse collection:
Noam Chomsky gave furiously sleep ideas green colorless as an example of a random sequence of words which could have no meaning.
No, no, NO!!! This is so wrong that I'm wondering if James was making some sort of joke. But I can't see what that would be. So, to straighten things out:
This is not quite correct.
1. He got the phrase backward: It's "colorless green ideas sleep furiously."
Chomsky used two examples: "colorless green ideas sleep furiously" and "furiously sleep ideas green colorless." The former set of words sounds like a sentence (even though it makes no sense), the latter does not sound like a sentence (and also does not make sense).
2. It's not a random sequence of words. It's a very deliberate sequence of words, the reverse of a prhase that make perfect grammatical (or syntactic, I can never get these straight) sense. To use an analogy that James must be familiar with, "colorless green ideas" is like Jabberwocky--it sounds like English--all the parts of speech are in the right place. The difference, what makes the Chomsky sentence special, is that, first, the sentence makes no sense. But, beyond that, any two successive words of the sentence make no sense: Something green cannot be colorless, an idea cannot be green, ideas do not sleep, and you cannot sleep furiously. Chomsky's sentence is a work of beauty, and it was disappointing to see Clive James miss the pointpartly miss this point--in a book of poetry, no less!
Just a couple words about Clive James. One thing that I find appealing about him is that he's a writer in the David Owen mode (that is, David Owen the American journalist, not David Owen the English politician): serious, earnest, somewhat intelligent but a bit of a blockhead. Which I mean in a good way. Not clever-clever or even clever, but he wants to get things right.
P.S. Thanks to commenters for pointing out that my original blog was mistaken: Chomsky actually had two strings of words, not just one. in his famous article. So James did not get the phrase wrong (although he was in error in calling it "random").
P.P.S. Yes, I realize that James is originally from Australia. Nonetheless, I think my enjoyment of his writing is more a sign of Anglophilia than Australiophilia on my part.
A famous computer scientist, Edsger W. Dijkstra, was writing short memos on a daily basis for most of his life. His memo archives contains a little over 1300 memos. I guess today he would be writing a blog, although his memos do tend to be slightly more profound than what I post.
Here are the rules (follow link for commentary), which I tried to summarize:
- Pursue quality and challenge, avoid routine. ("Raise your quality standards as high as you can live with, avoid wasting your time on routine problems, and always try to work as closely as possible at the boundary of your abilities. Do this, because it is the only way of discovering how that boundary should be moved forward.")
- When pursuing social relevance, never compromise on scientific soundness. ("We all like our work to be socially relevant and scientifically sound. If we can find a topic satisfying both desires, we are lucky; if the two targets are in conflict with each other, let the requirement of scientific soundness prevail.")
- Solve the problems nobody can solve better than you. ("Never tackle a problem of which you can be pretty sure that (now or in the near future) it will be tackled by others who are, in relation to that problem, at least as competent and well-equipped as you.")
[D+1: Changed "has been" into "was" - the majority of commenters decided Dijkstra is better treated as a dead person who was, rather than an immortal who "has been", is, and will be.]
Interesting article by Sharon Begley and Mary Carmichael. They discuss how there is tons of federal support for basic research but that there's a big gap between research findings and medical applications--a gap that, according to them, arises not just from the inevitable problem that not all research hypotheses pan out, but because actual promising potential cures don't get researched because of the cost.
I have two thoughts on this. First, in my experience, research at any level requires a continuing forward momentum, a push from somebody to keep it going. I've worked on some great projects (some of which had Federal research funding) that ground to a halt because the original motivation died. I expect this is true with medical research also. One of the projects that I'm thinking of, which I've made almost no progress on for several years, I'm sure would make a useful contribution. I pretty much know it would work--it just takes work to make it work, and it's hard to do this without the motivation of it being connected to other projects.
My second thought is about economics. Begley and Carmichael discuss how various potential cures are not being developed because of the expense of animal and then human testing. I guess this is part of the expensive U.S. medical system, that simple experiments cost millions of dollars. But I'm also confused: if these drugs are really "worth it" and would save lots of lives, wouldn't it be worth it for the drug and medical device companies to expend the dollars to test them? There's some big-picture thing I'm not understanding here.
My talks at Cambridge this Wed and Thurs in the department of Machine Learning.
Powerpoints are here and here. Also some videos are here (but no videos of the "Nothing is Linear, Nothing is Additive" talk).
A few years ago we went to a nearby fried chicken place that the Village Voice had raved about. While we were waiting to place our order, someone from the local Chinese takeout place came in with a delivery, which the employees of the chicken place proceeded to eat. This should've been our signal to leave. Instead, we bought some chicken. It was terrible.
On the basis of two papers and because it is completely obvious, we (meaning me, Justin, and John) predict that Elena Kagan will get confirmed to be an Associate Justice of the Supreme Court. But we also want to see how close we can come to predicting the votes for and against.
We actually have two sets of predictions, both using the MRP technique discussed previously on this blog. The first is based on our recent paper in the Journal of Politics showing that support for the nominee in a senator's home state plays a striking role in whether she or he votes to confirm the nominee. The second is based on a new working paper extending "basic" MRP to show that senators respond far more to their co-partisans than the median voter in their home states. Usually, our vote "predictions" do not differ much, but there is a group of senators who are predicted to vote yes for Kagan with a probability around 50% and the two sets of predictions thus differ for Kagan more than usual.
The other key factors that enter into the models (which build on the work of Cameron, Segal, Songer, Epstein, Lindstadt, Segal, and Westerland) are senator and nominee ideology, party and partisan control, presidential approval, nominee quality, and nomination timing.
The bottom line? The older model predicts nine Republican defections (votes for Kagan) but the newer model breaking down opinion by party predicts only five. Ten Republicans straddle or push against the 50% mark for point predictions.
Median state-level support for Kagan is approximately that for Alito, and about nine points higher than that for Sotomayor. Median state-level support for Kagan among Republicans is about 12 points higher than for Sotomayor. On the other hand, Obama's approval is definitely lower. So far, we have only one national poll to work with (which we thank ABC for), but we will update our data and "predictions" later when other poll data become available. We do not yet have Jeff Segal's official scores for quality and ideology so are currently fudging these a bit (using the same scores as for Sotomayor).
First, here is the distribution of opinion across states by party groups (using an extension to the MRP technique to generate not only opinion by state using national polls, but opinion by party by state):

Next, here are the predicted probabilities of a positive confirmation vote for Republican senators (Democrats are all predicted to vote yes):

If only Lindsey Graham would do the right thing and vote no...
From "Judge Savage," by Tim Parks:
That evening, Daniel called Hilary's parents. These people always disliked me, he knew. He had never understood if it was a racial thing, or whether they would have disliked any partner of Hilary's.
Very clever. Parks demonstrates Daniel's blind spot--he can't imagine that maybe Hilary's parents hate him because of his unpleasant personality--but does it entirely from Daniel's perspective. I wonder if this just came naturally to Parks, or whether he figured it out as a puzzle to solve--how to convey a blind spot from the perspective of the person looking and not noticing it--or whether Parks wasn't thinking at all about this and it just happened.
Considering the character Daniel's psychology, I'd consider the above as an example of the so-called fundamental attribution error, in that he's attributing Hilary's parents dislike of him to situational factors rather than to his own personality.
I'll have more on "Judge Savage" later (on the topic of "fighting the last war").
Here's a pretty funny example of silly statistics, caught by Lisa Wade:
A study published in 2001 . . . asked undergraduate college students their favorite color and presented the results by sex. Men's favorites are on the left, women's on the right:

The authors of the study, Lee Ellis and Christopher Ficek, wrote:
We are inclined to suspect the involvement of neurohormonal factors. Studies of rats have found average sex differences in the number of neurons comprising various parts of the visual cortex. Also, gender differences have been found in rat preferences for the amount of sweetness in drinking water. One experiment demonstrated that the sex differences in rat preferences for sweetness was eliminated by depriving males of male-typical testosterone levels in utero. Perhaps, prenatal exposure to testosterone and other sex hormones operates in a similar way to "bias" preferences for certain colors in humans.
As Wade points out, that all seems a bit ridiculous given some much more direct stories based on the big-time association of pink and blue with girls and boys.
No big deal, it's just sort of funny to see this sort of pseudoscientific explanation in such pure form.
And what kind of person lists green as their favorite color? 20% and 29%? I can't believe it! Sure, green is the color of money, but still . . .
P.S. That blog entry has 68 comments! I don't think there's really so much to say about this study. I guess it's like 538: the commenters just start arguing with each other.
P.P.S. This one is pretty funny too. (See here for more detail.)
I have an optimization problem: I have a complicated physical model that predicts energy and thermal behavior of a building, given the values of a slew of parameters, such as insulation effectiveness, window transmissivity, etc. I'm trying to find the parameter set that best fits several weeks of thermal and energy use data from the real building that we modeled. (Of course I would rather explore parameter space and come up with probability distributions for the parameters, and maybe that will come later, but for now I'm just optimizing). To do the optimization, colleagues and I implemented a "particle swarm optimization" algorithm on a massively parallel machine. This involves giving each of about 120 "particles" an initial position in parameter space, then letting them move around, trying to move to better positions according to a specific algorithm. We gave each particle an initial position sampled from our prior distribution for each parameter. So far we've run about 140 iterations, and I just took a look at where the particles are now. They are indeed converging -- that is, they're coming to some agreement on what the best region of parameter space is. But the standard deviation for each parameter is still about 0.4 times what it was at the start. (For instance, we put in a very wide prior distribution for the thermal mass of the furnishings in the building's offices, and after running the optimization the distribution is about 0.4 times as wide as it was at the start).
I was, and still am, a bit disappointed by this, but: we have 74 parameters. Our particles were spread through a huge volume of parameter space, and now they're spread through a space that is about 0.4 times as big for each parameter. That means they've agreed on a volume of parameter space that is about 0.4^74 times smaller than it was before, or about a factor of 10^29 smaller. Maybe it's not so bad.
A couple years ago, upon the selection of Sarah Palin as vice-presidential nominee, I made some graphs of the popularity of governors of different-sized states:

As I wrote at the time:
It seems to be easier to maintain high approval in a small state. What's going on? Some theories: in a large state, there will be more ambitious politicians on the other side, eager to knock off the incumbent governor; small states often have part-time legislatures and thus the governor is involved in less political conflict; small states (notably Alaska) tend to get more funds per capita from the federal government, and it's easier to be popular when you can disburse more funds; large states tend to be more heterogeneous and so it's harder to keep all the voters happy.
I was curious how things have been going more recently, and Hanfei made an updated graph using data from this archive. Here's the story:

There's lots of variation--clearly there are many other factors than state population that predict governors' popularity--but we continue to see more the more popular governors in smaller states.
The problem also calls out for some regression analysis to compare for factors other than state size. We haven't done a lot here, but we did regress governors' approval on two variables:
- log (state population),
- percent change in average personal income in the state in the past year.
Here's what we found:
> display (lm (popularity ~ c.log.statepop + c.income.change))
coef.est coef.se
(Intercept) 48.57 2.15
c.log.statepop -6.10 2.26
c.income.change 2.44 1.68
According to these results, governors of large states are still less popular than governors of small states, on average, even after controlling for recent economic performance. (We also tried a regression including the interaction of these two predictors, but I won't bother showing it: the coefficient of the interaction was small and the other coefficients were essentially unchanged.) It's possible that we didn't use the best economic variables, but, for now, I'd say that the evidence is pretty clear that it's tougher being a governor of a large state.
Matthew Yglesias and Megan McArdle argue about the economics of landlord/tenant laws in D.C., a topic I know nothing about. But it did remind me of a few stories . . .
1. In grad school, I shared half of a two-family house with three other students. At some point, our landlord (who lived in the other half of the house) decided he wanted to sell the place, so he had a real estate agent coming by occasionally to show the house to people. She was just a flat-out liar (which I guess fits my impression based on screenings of Glengarry Glen Ross). I could never decide, when I was around and she was lying to a prospective buyer, whether to call her on it. Sometimes I did, sometimes I didn't.
2. A year after I graduated, the landlord actually did sell the place but then, when my friends moved out, he refused to pay back their security deposit. There was some debate about getting the place repainted, I don't remember the details. So they sued the landlord in Mass. housing court and won triple damages. The funny thing was, the landlord was the editor of the Harvard Law Review. (But, no, he was not Barack Obama.) At the time, I told my former roommates that they should write up the story and send it to the local newspapers: President of Harvard Law Review Loses Lawsuit, etc etc.
3. During my first year in Berkeley, California, I lived in what I think was an illegal dwelling--a little one-bedroom house in somebody's backyard. It was fully functional with gas, plumbing, and electricity, but it didn't have its own house number--my mail came in the same mailbox that was used for the main house (where the landlord lived).
I also had some sort of illegally-spliced cable TV that worked most of the time. A few days after moving in to the place, I'd had a busy Monday at my very first real job. I got home, cleaned up a bit, then at 9pm I sat down on the couch to relax and watch some Monday night football. I turned on the TV, and . . . the game was ending! I'd forgotten that things start earlier in California.
Anyway, I was happy in that house but eventually had to leave when I got a cat. Actually, the landlord told me I could keep the cat for an extra $50/month in rent, but I did some searching and found a larger place in a more convenient neighborhood for about $75/month less so I left. There was a bit of a disagreement about the security deposit--par for the course, I guess. My landlord was a real clown, but the funny thing is that she and I got along fine until that little dispute.
4. Getting back to Massachusetts . . . several years later I knew somebody who owned a house that she rented out. At some point she had a difficult tenant who sued my friend for triple damages. I knew enough about the case to be pretty sure that my friend was in the right here, and it was pretty clear that the housing court was seriously biased in favor of the tenant. The flip side of case #2 above, I guess.
Dan Kahan writes:
Here is a very interesting article form Science that reports result of experiment that looked at whether people bought a product (picture of themselves screaming or vomiting on roller coaster) or paid more for it when told "1/2 to charity." Answer was "buy more" but "pay lots less" than when alternative was fixed price w/ or w/o charity; and "buy more" & "pay more" if consumer could name own price & 1/2 went to charity than if none went to charity. Pretty interesting.
But . . .
Continue reading Roller coasters, charity, profit, hmmm.
This makes sense:
In the land of fiction, it's the criminal's modus operandi - his method of entry, his taste for certain jewellery and so forth - that can be used by detectives to identify his handiwork. The reality according to a new analysis of solved burglaries in the Northamptonshire region of England is that these aspects of criminal behaviour are on their own unreliable as identifying markers, most likely because they are dictated by circumstances rather than the criminal's taste and style. However, the geographical spread and timing of a burglar's crimes are distinctive, and could help with police investigations.
And, as a bonus, more Tourette's pride!
P.S. On yet another unrelated topic from the same blog, I wonder if the researchers in this study are aware that the difference between "significant'' and "not significant'' is not itself statistically significant.
David Blackwell was already retired by the time I came to Berkeley, and probably our closest connection was that I taught the class in decision theory that he used to teach. I enjoyed that class a lot, partly because it took me out of my usual comfort zone of statistical inference and data analysis toward something more theoretical and mathematical. Blackwell was one of the legendary figures in the department at that time and was also one of the most tolerant of alternative approaches to statistics, perhaps because of combination of a mathematical background, applied research in the war and after (which I learned about in this recent obituary), and personal experiences,
Blackwell may be best known in statistics for the Rao-Blackwell theorem. Rao, of course, is also famoust for the Cramer-Rao lower bound. Both theorems relate to minimum-variance statistical estimators.
Here's a quote from Thomas (Jesus's dad) Ferguson in Blackwell's obituary:
He went from one area to another, and he'd write a fundamental paper in each, He would come into a field that had been well studied and find something really new that was remarkable. That was his forte.
And here's a quote from Peter Bickel, who in 1967 published an important paper on Bayesian inference:
He had this great talent for making things appear simple, He liked elegance and simplicity. That is the ultimate best thing in mathematics, if you have an insight that something seemingly complicated is really simple, but simple after the fact.
And here's Blackwell himself, from 1983:
Basically, I'm not interested in doing research and I never have been, I'm interested in understanding, which is quite a different thing. And often to understand something you have to work it out yourself because no one else has done it.
I'm surprised to hear Blackwell consider "research" and "understanding" to be different, as to me they seem to be closely related. One of the most interesting areas of statistical research today is on methods for understanding models as maps from data to predictions. As Blackwell and his collaborators demonstrated, even the understanding of simple statistical inferences is not a simple task.
P.S. According to the obituary, Blackwell was denied jobs at Princeton and the University of California because of racial discrimination, and so, a year after receiving his Ph.D., he "sent out applications to 104 black colleges on the assumption that no other schools would hire him." The bit about the 104 job applications surprised me. Nowadays I know that people send out hundreds of job applications, but I didn't know that this was done back in 1943. I somehow thought the academic world was more self-contained back then.
P.P.S. My Barnard College colleague Rajiv Sethi discusses Blackwell's research as seen by economists.
Daniel Corsi writes:
I was wondering if you could help me with some code to set up a posterior predictive check for an unordered multinomial multilevel model. In this case the outcome is categories of bmi (underweight, nomral weight, and overweight) based on individuals from 360 different areas. What I would like to do is set up a replicated dataset to see how the number of overweight/underweight/normal weight individuals based on the model compares to the actual data and some kind of a graphical summary. I am following along with chapter 24 of the arm book but I want to verify that the replicated data accounts for the multilevel structure of the data of people within areas. I am attaching the code I used to run a simple model with only 2 predictors (area wealth and urban/rural designation).
My reply: The Bugs code is a bit much for me to look at--but I do recommend that you run it from R, which will give you more flexibility in preprocessing and postprocessing the data. Beyond this, there are different ways of doing replications. You can replicate new people in existing areas or new people in new areas. It depends on your application. In a cluster sample, you'll probably want new areas. In an exhaustive sample, there might not be any new areas and you'll want to keep your existing group-level parameters.
See here. Cool--it looks like they're doing interesting stuff, and it's great to see this sort of support for applied research.
John Kastellec, Jeff Lax, and Justin Phillips write:
Do senators respond to the preferences of their states' median voters or only to the preferences of their co-partisans? We [Kastellec et al.] study responsiveness using roll call votes on ten recent Supreme Court nominations. We develop a method for estimating state-level public opinion broken down by partisanship. We find that senators respond more powerfully to their partisan base when casting such roll call votes. Indeed, when their state median voter and party median voter disagree, senators strongly favor the latter. [emphasis added] This has significant implications for the study of legislative responsiveness, the role of public opinion in shaping the personnel of the nations highest court, and the degree to which we should expect the Supreme Court to be counter-majoritarian. Our method can be applied elsewhere to estimate opinion by state and partisan group, or by many other typologies, so as to study other important questions of democratic responsiveness and performance.
Their article uses Mister P and features some beautiful graphs.
A few weeks ago I wrote about the importance of demographics in political trends. Today I'd like to show you how demographics help predict financial crises.
Here are a few examples of countries with major crises.
- The working-age population in Japan peaked in the 1995 census.
- The 1995 Financial Crisis in Japan
- The working-age USA population growth slows down to unprecedented levels in 2008 (see figure below)
- Financial crisis of 2007-2010. (Also, notice previous dips in 2001, 1991 and 1981, and consider the list of recessions.)

- China's working-age population, age 15 to 64, has grown continuously. The labor pool will peak in 2015 and then decline.
There are more charts in Demography and Growth report by the Reserve Bank of Australia:

Wikipedia surveys the causes of the financial crisis, such as "liquidity shortfall in the United States banking system caused by the overvaluation of assets". Oh my! Slightly better than the usual Democrat-Republican finger pointing, but no, no, no, no. One has to pick the right variables to explain these things. Why were the assets overvalued?
There is a simple answer: not enough people have been looking at demographic trends to understand that it's the working-age population that buys most of the goods, services and real estate.
Back in 2007 I found a book by Henry S. Dent, the main message of which was nicely summarized by this March 2000 article in Businessweek:
The bull market is as vast and powerful as the baby boomer generation, and the two are inextricable. The 80 million or so boomers--those born between 1946 and 1964--are hitting their peak earning, spending, and investing years, and that's what's driving the economy's incredible performance and the stock market's spectacular returns. His target for the Dow is 40,000--which he believes it will hit somewhere around 2008.After that, watch out. As an economic force, the boomers will have peaked, and there just aren't enough Generation Xers to sustain the economic and stock market boom. Even the revolutionary changes wrought by the rapid growth of the Internet don't change that. In Dent's view, the economy goes into a deflationary funk for another 10 or so years, until the boomers' children--the 83 million ''echo baby boom'' generation--reach their economic prime.
Unfortunately for Dent, there was the 2001 dip before the 2008 drop.
Assuming economists finally learn the demographics they should have known for a long time, the next financial crisis will be caused by some other under-appreciated variable.
Dietrich Stoyan writes:
Continue reading Wanted: Probability distributions for rank orderings.
Gary Gates writes the following in response to the discussion of my recent blog on the difficulty of using "gaydar" to estimate the frequencies of gays in a population:
First, here's a better (I think, anyway) method than using AIDS deaths from the NY Times (yikes!) to estimate the % of the military that is gay or lesbian.
Gates estimates 2.2%, with, unsurprisingly, a higher rate among women than men.
He continues:
Here's a tale of the false positive problem affecting who gets counted as same-sex couples in the Census and attached is a working paper that updates those analyses (with better methods, I think) using ACS data.
In this paper, Gates (along with Dan Black, Seth Sanders, and Lowell Taylor) finds:
Our work indicates that over 40 percent of same-sex "unmarried partner" couples in the 2000 U.S. Decennial Census are likely misclassified different-sex couples.
40% misclassification. Wow.
On statisticians and statistical software:
Statisticians are particularly sensitive to default settings, which makes sense considering that statistics is, in many ways, a science based on defaults. What is a "statistical method" if not a recommended default analysis, backed up by some combination of theory and experience?
You know that expression, "Not from the Onion"? How did we say that, all those years before the Onion existed?
I was thinking about this after encountering (amidst a Google search for something else) this article on a website called "College News":
DANVILLE, KY., March 8, 2007--Two Centre College professors spent the past six years reading and analyzing 200 children's books to discover a disturbing trend: gender bias still exists in much of modern children's literature.Dr. David Anderson, professor of economics, and Dr. Mykol Hamilton, professor of psychology, have documented that gender bias is common today in many children's books in their research published recently in Sex Roles: A Journal of Research titled "Gender Stereotyping and Under-Representation of Female Characters in 200 Popular Children's Picture Books: A 21st Century Update." . . .
"Centre College," huh? That's where Area Man is studying, right?
According to the materials on its website, Centre College is ranked very high on some measures, and I wouldn't be surprised if it's an excellent place to get an education. Still, there's something Onion-like about all of this.
Yesterday I posted a review of a submitted manuscript where I first wrote that I read the paper only shallowly and then followed up with some suggestions on the statistical analysis, recommending that overdispersion be added to a fitted Posson regression and that the table of regression results be supplemented with a graph showing data and fitted lines.
A commenter asked why I wrote such an apparently shallow review, and I realized that some of the implications of my review were not as clear as I'd thought. So let me clarify.
There is a connection between my general reaction and my statistical comments. My statistical advice here is relevant for (at least) two reasons. First, a Poisson regression without overdispersion will give nearly-uninterpretable standard errors, which means that I have no sense if the results are statistically significant as claimed. Second, with a time series plot and regression table, but no graph showing the estimated treatment effect, it is very difficult for me to visualize the magnitude of the estimated effect. Both of these serious statistical problems lead to the problem noted at the beginning of my review, that I "didn't try to judge whether the conclusions are correct." It is the authors' job to correctly determine statistical significance (or use some other measure of uncertainty) and to put their estimates into context. How can I possibly judge correctness if I don't know whether the results are statistically significant and if I don't have a sense of how large they are compared to variation in the data? I liked the paper, and that's why I made my suggestions.
I just wrote this, and I realized it might be useful more generally:
The article looks reasonable to me--but I just did a shallow read and didn't try to judge whether the conclusions are correct. My main comment is that if they're doing a Poisson regression, they should really be doing an overdispersed Poisson regression. I don't know if I've ever seen data in my life where the non-overdispersed Poisson is appropriate. Also, I'd like to see a before-after plot with dots for control cases and open circles for treatment cases and fitted regression lines drawn in. Whenever there's a regression I like to see this scatterplot. The scatterplot isn't a replacement for the regression, but at the very least it gives me intuition as to the scale of the estimated effect. Finally, all their numbers should be rounded appropriately.
Feel free to cut-and-paste this into your own referee reports (and to apply these recommendations in your own applied research).
Megan Price wrote in that she and Daniel Guzmán of the Benetech Human Rights Program released a paper today entitled "Comments to the article 'Is Violence Against Union Members in Colombia Systematic and Targeted?'" (o aqui en español), which examines an article written by Colombian academics Daniel Mejía and María José Uribe. Price writes [in the third person]:
Continue reading Statistical controversy regarding human rights violations in Colomnbia.
Earlier today, Nate criticized a U.S. military survey that asks troops the question, "Do you currently serve with a male or female Service member you believe to be homosexual." [emphasis added] As Nate points out, by asking this question in such a speculative way, "it would seem that you'll be picking up a tremendous number of false positives--soldiers who are believed to be gay, but aren't--and that these false positives will swamp any instances in which soldiers (in spite of DADT) are actually somewhat open about their same-sex attractions."
This is a general problem in survey research. In an article in Chance magazine in 1997, "The myth of millions of annual self-defense gun uses: a case study of survey overestimates of rare events" [see here for related references], David Hemenway uses the false-positive, false-negative reasoning to explain this bias in terms of probability theory. Misclassifications that induce seemingly minor biases in estimates of certain small probabilities can lead to large errors in estimated frequencies. Hemenway discusses this effect in the context of traditional medical risk problems and then argues that this bias has caused researchers to drastically overestimate the number of times that guns have been used for self defense. Direct extrapolations from surveys suggest 2.5 million self-defense gun uses per year in the United States, but Hemenway shows how response errors could be causing this estimate to be too high by a factor of 10.
Here are a couple more examples from Hemenway's 1997 article:
The National Rifle Association reports 3 million dues-paying members, or about 1.5% of American adults. In national random telephone surveys, however, 4-10% of respondents claim that they are dues-paying NRA members. Similarly, although Sports Illustrated reports that fewer than 3% of American households purchase the magazine, in national surveys 15% of respondents claim that they are current responders.
Gays are estimated to be about 3% of the general population (whether the percentage is higher or lower in the military, I have no idea), so you can see how it can be very difficult to interpret the results of "gaydar" questions.
P.S. This post really is about guns and gaydar, not so much about God, but to maintain consistency with the above title, I'll link to this note on the persistent overreporting of church attendance in national surveys.
Mike Spagat writes:
Here is yet another debunking article I've written, this one in the latest issue of Significance. It shows the Lancet once again publishing spectacularly wrong information that has misinformed public discussion on a crucial issue with ongoing reverberations. For example, there is Tony Blair's recent justification for the Iraq war offered in front of the Chilcot Inquiry in the UK quoted at the beginning of the paper.
I haven't had a chance to look at this one, but here's a link to some related Spagat work.
I was reading this article by Ariel Levy in the New Yorker and noticed something suspicious. Levy was writing about an event in 1979 and then continued:
One year later, Ronald Reagan won the Presidency, with overwhelming support from evangelicals. The evangelical vote has been a serious consideration in every election since.
From Chapter 6 of Red State, Blue State:

According to the National Election Study, Reagan did quite a bit worse than Carter among evangelical Protestants than among voters as a whole--no surprise, really, given that Reagan was not particularly religious and Cater was an evangelical himself.
It was 1992, not 1980, when evangelicals really started to vote Republican.
What's it all about?
I wouldn't really blame Ariel Levy for this mistake; a glance at her website reveals a lot of experience as a writer and culture reporter but not much on statistics or politics. That's fine by me: there's a reason I subscribe to the New Yorker and not the American Political Science Review!
On the other hand, I do think that the numbers are important, and I worry about misconceptions of American politics--for example, the idea that Reagan won "overwhelming support from evangelicals." A big reason we wrote Red State, Blue State was to show people how all sorts of things they "knew" about politics were actually false.
Perhaps the New Yorker and other similar publications should hire a statistical fact checker or copy editor? Maybe this is the worst time to suggest such a thing, with the collapsing economics of journalism and all that. Still, I think the New Yorker could hire someone at a reasonable rate who could fact check their articles. This would free up their writers to focus on the storytelling that they are good at without having to worry about getting the numbers wrong.
Another option would be to write a letter to the editor, but I don't think the New Yorker publishes graphs.
P.S. I've written before about the need for statistical copy editors (see also here, here, and, of course, the notorious "But viewed in retrospect, it is clear that it has been quite predictable").
P.P.S. I think one of my collaborators made this graph, maybe by combining the National Election Study questions on religious denomination and whether the respondent describes him/herself as born again.
P.P.P.S. Somebody pointed out that Reagan did do well among white evangelicals, so maybe that's what Levy was talking about.
Suppose you and I agree on a probability estimate...perhaps we both agree there is a 2/3 chance Spain will beat Netherlands in tomorrow's World Cup. In this case, we could agree on a wager: if Spain beats Netherlands, I pay you $x. If Netherlands beats Spain, you pay me $2x. It is easy to see that my expected loss (or win) is $0, and that the same is true for you. Either of us should be indifferent to taking this bet, and to which side of the bet we are on. We might make this bet just to increase our interest in watching the game, but neither of us would see a money-making opportunity here.
By the way, the relationship between "odds" and the event probability --- a 1/3 chance of winning turning into a bet at 2:1 odds --- is that if the event probability is p, then a fair bet has odds of (1/p - 1):1.
More interesting, and more relevant to many real-world situations, is the case that we disagree on the probability of an event. If we disagree on the probability, then there should be a bet that we are both happy to make --- happy, because each of us thinks we are coming out ahead (in expectation). Consider an event that I think has a 1/3 chance of occurring, but you put the probability at only 1/10. If you offer, say, 5:1 odds --- I pay you $1 if the event doesn't occur, but you pay me $5 if it does --- each of us will think this is a good deal. But the same is true at 6:1 odds, or 7:1 odds. I should be willing to accept any odds higher than 2:1, and you should be willing to offer any odds up to 9:1. How should we "split the difference"?
I started pondering this question when I read the details of a wager, or rather a non-wager, that I had previously only heard about in outline: scientists James Annan and Richard Lindzen were unable to agree to terms for a bet about climate change. Lindzen thinks, or claims to think, that the "global temperature anomaly" is likely to be less than 0.2 C twenty years from now, but Annan thinks, or claims to think, it is very likely to be higher. You can imagine a disagreement over the details --- since the global temperature anomaly can't be measured exactly, perhaps you'd want to call off the bet (doing so is called a "push" in betting parlance) if the anomaly is estimated to be, say, between 0.18 and 0.22 C --- but surely, given that the probability assessments are so different, there should still be a wager that both sides are eager to make! But in fact, they couldn't agree on terms.
Chris Hibbert has discussed the issue of agreeing on a bet on his blog, where he mentions that Dan Reeves "argues, convincingly, that the arithmetic mean gives each party the same expectation of gain, and that is what fairness requires." But Hibbert goes on to say that "the way that bayesians would update their odds is to use the geometric mean of their odds." I'm not sure of the relevance of this latter statement, when it comes to making a fair bet.
Suppose I think the probability of a given event is a, and you think the probability is b. If the event occurs, you will pay me $x, and if it doesn't occur, I will pay you $y. We don't need to know the actual probability in order to figure out how much each of us thinks the bet is worth: I think I will gain ax - (1-a)y, and you think you will gain -bx + (1-b)y. We might say a wager is "reasonable" --- the word "fair" is already taken --- if I think it's worth as much to me as you think it is worth to you. Look at it this way: I should be willing to pay up to ax - (1-a)y to participate in this wager, and you should be willing to pay up to -bx + (1-b)y. If those amounts are equal, then we'd each be willing to pay the same amount to participate in this game.
Setting the two terms equal and doing the math, we end up with a reasonable bet if x= y(2-(a+b))/(a+b) or, equivalently, x = y(2/(a+b) - 1). Note that this is the same thing we would get if we agreed that the probability p = (a+b)/2. So, I agree with Dan Reeves and his co-authors: the way to make a reasonable bet is to take the arithmetic mean of the probability estimates.
Freakonomics reports:
A reader in Norway named Christian Sørensen examined the height statistics for all players in the 2010 World Cup and found an interesting anomaly: there seemed to be unnaturally few players listed at 169, 179, and 189 centimeters and an apparent surplus of players who were 170, 180, and 190 centimeters tall (roughly 5-foot-7 inches, 5-foot-11 inches, and 6-foot-3 inches, respectively). Here's the data:

It's not costless to communicate numbers. When we compare "eighty" (6 characters) vs "seventy-nine" (12 characters) - how much information are we gaining by twice the number of characters? Do people really care about height at +-0.5 cm or is +-1 cm enough?
It's harder to communicate odd numbers ("three" vs four or two, "seven" vs "six" or "eight", "nine" vs "ten") than even ones. As language tends to follow our behaviors, people have been doing it for a long time. We remember the shorter description of a quantity.
This is my theory why we end up with more rounded numbers. This is also partially why Benford's law holds: we change the scales and measurement units as to enable us to store the numbers in our minds more economically. Compare "ninety-nine" (11 characters) with "hundred" (7c), or "nine hundred ninety-nine" (24) with "thousand" (8c).
For our advanced readers, let me give you another example. Let's say I estimate something to be 100. The fact that I said 100 implies that there is a certain amount of uncertainty in my estimate. I could have written it as 1e2, implying that the real quantity is somewhere between 50 and 150. If I said 102, I'd be implying that the real quantity is between 101 and 103. If I said 103, I'd be implying that the real quantity is between 102.5 and 103.5. If I said 50, the real quantity is probably between 40 and 60.
This way, by rounding up, I have been both economical in my expression but also been able to honestly communicate my standard error.
Eventually, increased accuracy is not always worth the increased cost of communication and memorization.
So, do you still think World Cup players are being self-aggrandizing, or are they perhaps just economical or even conscious of standard errors?
[D+1: Hal Varian points to number clustering in asset markets. Also thanks to Janne helped improve the above presentation.]
Interesting mini-memoir from John Podhoretz about the Upper West Side, in his words, "the most affluent shtetl the world has ever seen."
The only part I can't quite follow is his offhand remark, "It is an expensive place to live, but then it always was." I always thought that, before 1985 or so, the Upper West Side wasn't so upscale. People at Columbia tell all sorts of stories about how things used to be in the bad old days.
I have one other comment. Before giving it, let me emphasize that enjoyed reading Podhoretz's article and, by making the comment below, I'm not trying to shoot Podhoretz down; rather, I'm trying to help out by pointing out a habit in his writing that might be getting in the way of his larger messages.
Podhoretz writes the following about slum clearance:
Continue reading Life in New York, Then and Now.
From Ira Stoll, a link to this cool data site, courtesy of the Manhattan Institute, with all sorts of state budget information including the salaries of all city and state employees.
David Shor writes:
I'm dealing with a situation where I have two datasets, one that assigns each participant a discrete score out of five for a set of particular traits (Dog behavior characteristics by breed), and another from an independent source that ranks each breed by each characteristic. It's also possible to obtain the results of a survey, where experts were asked to rank 7 randomly picked breeds by characteristics.I'm interested in obtaining estimates for each trait, and intuitively, it seems clear that the second and third dataset provide a lot of information. But it's unclear how to incorporate them to infer latent variables, since only sample ranks are observed. This seems like it is a common problem, do you have any suggestions?
My quick answer is that you can treat ranks as numbers (a point we make somewhere in Bayesian Data Analysis, I believe) and just fit an item-response model from there.
Val Johnson wrote an article on this in Jasa a few years ago, "Bayesian analysis of rank data with application to primate intelligence experiments." He also did similar work calibrating college grades.
The recent discussion of pollsters reminded me of a story from a couple years ago that perhaps is still relevant . . .
I was looking up the governors' popularity numbers on the web, and came across this page from Rasmussen Reports which shows Sarah Palin as the 3rd-most-popular governor. But then I looked more carefully. Janet Napolitano of Arizona was viewed as Excellent by 28% of respondents, Good by 27%, Fair by 26%, and Poor by 27%. That adds up to 108%! What's going on?
I'd think they would have a computer program to pipe the survey results directly into the spreadsheet. But I guess not, someone must be typing in these numbers one at a time. Another possibility is that they are altering their numbers by hand, and someone made a mistake with the Napolitano numbers, adding a few percent in one place and forgetting to subtract elsewhere. Or maybe there's another explanation?
Continue reading Rasmussen sez: "108% of Respondents Say . . .".
I'm on an island in Maine for a few weeks (big shout out for North Haven!) This morning I picked up a copy of "Working Waterfront," a newspaper that focuses on issues of coastal fishing communities. I came across an article about modeling "fish" populations --- actually lobsters, I guess they're considered "fish" for regulatory purposes. When I read it, I thought "wow, this article is really well-written, not dumbed down like articles in most newspapers." I think it's great that a small coastal newspaper carries reporting like this. (The online version has a few things that I don't recall in the print version, too, so it's even better). But in addition to being struck by finding such a good article in a small newspaper, I was struck by this:
According to [University of Maine scientist Yong] Chen, there are four main areas where his model improved on the prior version. "We included the inshore trawl data from Maine and other state surveys, in addition to federal survey data; we had better catch data to work with than before; we had more realistic biology built into our virtual lobsters; and we used a statistical approach that incorporates margins of error in our inputs (this approach uses Bayesian statistics)," he said.
The phrase "virtual lobsters" is kinda nice, I think. But check out the seemingly gratuitous mention of Bayesian statistics. There's just no way the intended audience for this article is expected to know what Bayesian statistics is --- unlike "v-notching protection", which is mentioned elsewhere but the article doesn't bother to explain because, hey, everybody knows what v-notching protection is.
I'm not sure why Bayesian statistics is mentioned here. Just to throw in some jargon in order to sound sophisticated? Or is there some sense that people won't know what Bayesian statistics is, but maybe they've heard that it's a good thing?
John Keltz writes:
What do you think about curved lines connecting discrete data-points? (For example, here.)The problem with the smoothed graph is it seems to imply that something is going on in between the discrete data points, which is false. However, the straight-line version isn't representing actual events either- it is just helping the eye connect each point. So maybe the curved version is also just helping the eye connect each point, and looks better doing it.
In my own work (value-added modeling of achievement test scores) I use straight lines, but I guess I am not too bothered when people use smoothing. I'd appreciate your input.
Regular readers will be unsurprised that, yes, I have an opinion on this one, and that this opinion is connected to some more general ideas about statistical graphics.
In general I'm not a fan of the curved lines. They're ok, but I don't really see the point. I can connect the dots just fine without the curves.
The more general idea is that the line, whether curved or straight, serves two purposes: first, it's an (interpolative) estimate of some continuous curve; second, it makes short-term trends apparent in a way that's harder to see from the points alone. The straight line also serves a third purpose, which is to make clear the reliance on the original data. To put it another way, if I'm doing a simple interpolation, I want it to be clear that I'm doing a simple interpolation--and the straight lines make this clear. The curved lines, not so much. Maybe they're from some model? To me, the added ambiguity is more of a cost than the smoother interpolation is a benefit.
Jeff the Productivity Sapper points me to this insulting open letter to Nate Silver written by pollster John Zogby. I'll go through bits of Zogby's note line by line. (Conflict of interest warning: I have collaborated with Nate and I blog on his site).
Zogby writes: Here is some advice from someone [Zogby] who has been where you [Silver] are today.
Sorry, John. (I can call you that, right? Since you're calling Nate "Nate"?). Yes, you were once the hot pollster. But, no, you were never where Nate is today. Don't kid yourself.
Zogby writes: You [Nate] are hot right now - using an aggregate of other people's work, you got 49 of 50 states right in 2008.
Yes, Nate used other people's work. That's what's called "making use of available data." Or, to use a more technical term employed in statistics, it's called "not being an idiot." Only in the wacky world of polling are you supposed to draw inferences about the U.S.A. using only a single survey organization. I do agree that it wasn't particularly impressive to get 49 states out of 50. What made Nate's name was not his routine election-night forecast but his exceptional insight during the primary election season, followed up by strong and timely analyses during the following months. If you think that's so easy, fine: You do it. Until then, how about some division of labor, where analysts such as Nate make use of polling data and pollsters such as John respect that their polls will be used in all sorts of interesting ways once their data go out the door.
Continue reading A note to John.
John Sides reports on this finding by Paul Gronke, Darius Rejali, Dustin Drenguis, James Hicks, Peter Miller, and Bryan Nakayama, from a survey in 2008::

Gronke et al. write (as excerpted by Sides):
Many journalists and politicians believe that during the Bush administration, a majority of Americans supported torture if they were assured that it would prevent a terrorist attack....But this view was a misperception...we show here that a majority of Americans were opposed to torture throughout the Bush presidency...even when respondents were asked about an imminent terrorist attack, even when enhanced interrogation techniques were not called torture, and even when Americans were assured that torture would work to get crucial information. Opposition to torture remained stable and consistent during the entire Bush presidency.
Gronke et al. attribute confusion of beliefs to the so-called false consensus effect studied by cognitive psychologists, in which people tend to assume that others disagree with them. For example:
The 30% who say that torture can "sometimes" be justified believe that 62% of Americans do as well, and think that another 8% "often" approve of torture.
But maybe these people were just ahead of their time:
A public majority in favor of torture did not appear until, interestingly, six months into the Obama administration.
I'd be interested in how this breaks down by partisanship. Is this related to the idea that we now see little public opposition to the Afghanistan and Iraq wars because liberal Democrats are the political/ideological group that are most antiwar, and their opposition is defused because of their general support for the Obama administration? Or maybe something else is going on; I'd be interested in seeing more.
To the person who posted an apparently non-spam comment with a URL link to a "cheap cigarettes" website: In case you're wondering, no, your comment didn't get caught by the spam filter--I'm not sure why not, given that URL. I put it in the spam file manually. If you'd like to participate in blog discussion in the future, please refrain from including spam links. Thank you.
Also, it's "John Tukey," not "John Turkey."
Another stereotype is affirmed when I go on the U.K. rail system webpage and it repeatedly times out on me. At one point I have a browser open with the itinerary I'm interested in, and then awhile later I reopen the window (not clicking on anything on the page, just bringing the window up on the screen) but it's timed out again.
P.S. Yes, yes, I know that Amtrak is worse. Still, it's amusing to see a confirmation that, at least in one respect, the British trains are as bad as they say.
The other day I came across a paper that referred to Charlie Geyer's 1991 paper, "Estimating Normalizing Constants and Reweighting Mixtures in Markov Chain Monte Carlo." I expect that part or all of this influential article was included in some published paper, but I only know it as a technical report--which at the time of this writing has been cited an impressive 78 times!
This made me wonder: what are the most influential contributions to statistics that were never published (not counting posthumous publication or decades-later reprints in compilation volumes).
Here's all that I can think of:
- Thomas Bayes's original article, published only in 1763, two years after his death.
- John Tukey's legendary manuscript on multiple comparisons from the 1950s. I actually think Tukey's work on multiple comparisons was horribly illogical stuff, very clever but also bad bad bad, and I'm very happy that he moved on to other things. But I can't deny that his unpublished multiple comparisons book was highly influential.
- The paper by Hammersley and Clifford with their eponymous theorem about conditional independence, a legendary work that I think was never published because it was superseded by Besag's classic 1974 paper on spatial statistics.
- E. T. Jaynes's book on probability theory, which in his lifetime only existed as an incomplete pdf file.
- Geyer's aforementioned 1991 paper on computing normalizing constants.
Any other important unpublished statistical works?
(In political science, Larry Bartels must have set the record for the most influential set of unpublished papers (some of which made their way into his Unequal Democracy book).
Several people asked me for my thoughts on Richard Wilkinson and Kate Pickett's book, "The Spirit Level: Why Greater Equality Makes Societies Stronger." I've outsourced my thinking on the topic to Lane Kenworthy.
Jimmy passes this article by Ahmad Reza Hosseinpoor and Carla AbouZahr. I have little to say, except that (a) they seem to be making a reasonable point, and (b) those bar graphs are pretty ugly.
See here for latest rant.
The fun part of this entry comes near the end.
Amanda Marcotte has some nice things to say about Red State, Blue State and connects our findings with some current political conflicts. She picks up on our theme of perception and reality, that national journalists live in a different world and can have difficulty grasping national voting patterns:
Continue reading The moral of the story is, Don't look yourself up on Google.
David Shor writes:
My lab recently got some money to get a high-end machine. We're mostly going to do MCMC stuff, is there anything specialized that I should keep in mind, or would any computing platform do the job?
I dunno, any thoughts out there? I've heard that "the cloud" is becoming more popular.
I came across the following headline:
Unemployment Extension Fails: Senate Rejects Jobless Benefits 58-38
Actually, though, the Senate voted 58-38 in favor of the bill. But the opponents did a filibuster. Here's another try:
Congress Fails to Pass an Extension of Jobless Aid
But it's still not clear that the vote was strongly in favor--not even close, in fact. A better headline, I think, would be:
Senate Vote on Unemployment Extension: 58-38 in Favor, Not Enough to Beat Filibuster
Or maybe someone more journalistic than I can come up with something better?
Tyler Cowen hypothesizes a "dogmatism portfolio" or a "quota of dogmatism": in his words,
If you're very dogmatic in one area, you may be less dogmatic in others.
OK, well "may be" is pretty vague. There's not really anything to disagree with, yet. But then Cowen continues:
StackOverflow has been a popular community where software developers would help one another. Recently they raised some VC funding, and to make profits they are selling job postings and expanding the model to other areas. Metaoptimize LLC has started a similar website, using the open-source OSQA framework for such as statistics and machine learning. Here's a description:
You and other data geeks can ask and answer questions on machine learning, natural language processing, artificial intelligence, text analysis, information retrieval, search, data mining, statistical modeling, and data visualization.
Here you can ask and answer questions, comment and vote for the questions of others and their answers. Both questions and answers can be revised and improved. Questions can be tagged with the relevant keywords to simplify future access and organize the accumulated material.
If you work very hard on your questions and answers, you will receive badges like "Guru", "Student" or "Good answer". Just like a computer game! In return, well-meaning question answerers will be helping feed Google and numerous other companies with good information they will offer the public along with sponsored information that someone is paying for.
I'll join the party myself when they introduce the "Rent," "Mortgage Payment," "Medical Bill", and "Grocery" badges. Until then, I'll be spending time and money, and someone else will be saving time and earning money. For a real community, there has to be some basic fairness.
[9:15pm: Included Ryan Shaw's correction to my post, pointing out that MetaOptimize is based on OSQA and not on the StackOverflow platform.]
[D+1, 7:30am: Igor Carron points to an initiative that's actually based on the StackOverflow.]
A comment by Mark Palko reminded me that, while I'm a huge Marquand fan, I think The Late George Apley is way overrated. My theory is that Marquand's best books don't fit into the modernist way of looking about literature, and that the gatekeepers of the 1930s and 1940s, when judging Marquand by these standards, conveniently labeled Apley has his best book because it had a form--Edith-Wharton-style satire--that they could handle. In contrast, Point of No Return and all the other classics are a mixture of seriousness and satire that left critics uneasy.
Perhaps there's a way to study this sort of thing more systematically?
Rajiv Sethi writes:
I suspect that within a decade, blogs will be a cornerstone of research in economics. Many original and creative contributions to the discipline will first be communicated to the profession (and the world at large) in the form of blog posts, since the medium allows for material of arbitrary length, depth and complexity. Ideas first expressed in this form will make their way (with suitable attribution) into reading lists, doctoral dissertations and more conventionally refereed academic publications. And blogs will come to play a central role in the process of recruitment, promotion and reward at major research universities. This genie is not going back into its bottle.
And he thinks this is a good thing:
In fact, the refereeing process for blog posts is in some respects more rigorous than that for journal articles. Reports are numerous, non-anonymous, public, rapidly and efficiently produced, and collaboratively constructed. It is not obvious to me [Sethi] that this process of evaluation is any less legitimate than that for journal submissions, which rely on feedback from two or three anonymous referees who are themselves invested in the same techniques and research agenda as the author.
I don't disagree with these sentiments, although I do think that, if blogging every becomes important in statistics, it will come much slower than in economics, political science, computer science, or even mathematics. Blogging has been big since 2003--that's the year when, it seems to me, the general practice of trackbacking and blogrolling started to go away, leaving new blogs to be found on their own rather than through a network of references. But in all these years, very few statistics blogs have achieved much attention.
Sethi points out that, compared to journal articles, blog entries can be subject to more effective criticism. Beyond his point (about a more diverse range of reviewers), blogging also has the benefit that the discussion can go back and forth. In contrast, the journal reviewing process is very slow, and once an article is published, it typically just sits there. I personally like to publish discussion papers (that is, articles where others discuss and then I write a rejoinder), but most published journal articles don't have that format. (In that way, statistics may be better than economics. The field of statistics appears to accept that articles are attempts rather than realizations of perfection, whereas my impression is the economists worship at the altar of the "home run," the article that is such a perfect jewel that it is beyond criticism.
Can/should the blogosphere replace the journal-sphere in statistics? I dunno. At times I've been able to publish effective statistical reactions in blog form (see, for example, my skepticism about reported statistical significance in a brain-scan study) or to use the blog as a sort of mini-journal to collect different viewpoints (for example, our discussion with Pearl, Dawid, and others on causal inference). And when it comes to pure ridicule (I think you know who I'm thinking of here), maybe blogging is actually more appropriate than formally writing a letter to the editor of a journal.
But I don't know if blogs are the best place for technical discussions. This is true in economics as much as in statistics, but the difference is that many people have argued (perhaps correctly) that econ is already too technical, hence the prominence of blog-based arguments is maybe a move in the right direction. Even technical types such as Paul Krugman and Greg Mankiw have become much more talky and less algebraic as bloggers than as authors of journal articles.
Statistics, though, is different. Setting aside debates about whether Ph.D. students in statistics should learn the strong law of large numbers (I think you can guess my position on that one), even the applied stuff that I do is pretty technical--algebra, calculus, differential equations, infinite series, and the like.
Can this sort of highly-technical material be blogged? Maybe so. Igor Carron does it, and so does Cosma Shalizi--and both of them, in their technical discussions, clearly link the statistical material to larger conceptual questions in scientific inference and applied questions about the world. But this sort of blogging is really hard--much harder, I think, than whatever it takes for an economics professor with time on his or her hands to regularly churn out readable and informative blogs at varying lengths commenting on current events, economic policy, the theories of micro- and macro-economics, and all the rest.
I think few will disagree that the most effective statistics blogging, by a longshot, has been Nate Silver's polling and election analysis on fivethirtyeight.com. Here,
Nate and I have actually published a couple of journal articles based on material related to the blog, but (a) the journal articles are quite a bit more technical than the blog entries, and (b) as journal articles, they don't represent major research efforts--rather, they fall into the "fun applications" category. Ultimately, Nate's blogging succeeds because it is news, not because of its research content. From another direction, I think Scott Sumner's econ blogging succeeds because it is well-written and because it supports a fiscally-conservative position that many people want to hear. Krugman's blog works because it's linked to a popular New York Times column and he takes a strongly partisan political stance, and Levitt and Dubner's blog succeeds along the same lines as Cowen and Tabarrok's--readers are getting a mix of news, provocation, and bite-sized analyses. All of these play important roles, but not quite the roles of journal articles.
On the other hand, the current system of scientific journals is, in many ways, a complete joke. The demand for referee reports of submitted articles is out of control, and I don't see Arxiv as a solution, as it has its own cultural biases. I agree with Sethi that some sort of online system has to be better, but I'm guessing that blogs will play more of a facilitating informal discussions rather than replacing the repositories of formal research. I could well be wrong here, though: all I have are my own experiences, I don't have any good general way of thinking about this sort of sociology-of-science issue.
In the past decades violent means of grabbing power have been discredited and internationally regulated. Still, grabbing power is as desired as it has always been, and I'd like to introduce some new methods used today:
- Establish your base of power by achieving a critical mass (75%+) within a group with a high barrier to entry. Examples of barriers to entry: genetics (familiar ties, skin, eye color, hair type - takes 2+ generations to enter), religion (takes 2-10 years to enter), language (very hard to enter after the age of 10).
- Encourage your followers to have many children - because of common ethical concerns, other groups will help you bring them up.
- Control the system of indoctrination, such as religious schooling, government-based educational system, entertainment, popular culture - limiting the loss of children to out-group (only needed for non-genetic barriers to entry).
- Wait 18 years for your followers' children to become eligible to vote.
- Win elections by popular vote - and have the option of abolishing democracy and instituting the rule by in-group.
Other tricks of the trade:
- Support economic and social policies that benefit the in-group disproportionally more than out-group.
- Supporting the immigration of people that can join the group, or evangelize your message to potential followers.
- Focus on out-group members in distress, as they appreciate help, become more willing to convert, and are more eager about in-group.
- Support emigration of out-group members.
Barriers to entry are an important factor that strengthens the internal cohesion of the group and helps maintain the base of power you've established.
This strategy has been and is being applied in numerous countries, and is a weaker form of genocide especially when the in-group is based on genetics.
Disclaimer: I do not endorse such (or any) power-grabbing strategies. I believe that being aware of such strategies is the first step to making the world a better place. I find that structuring research findings in the form of "How to"s and "5 Easy Steps" appealing to self-interest communicate information more efficiently than academic treatises in today's conditions of information overload.
Bibliography: Jack Parsons (who sadly recently passed away) wrote a book, Population Competition for Security or Attack: A Study of the Perilous Pursuit of Power Through Weight of Numbers." Nobody wanted to publish it, though, so Jack had to start his own publishing house.
What do you think?
[July 5, Stefano Bertolo points to Bryan Caplan's article on "liberty in the long term".]
I came across this article on the philosophy of statistics by University of Michigan economist John DiNardo. I don't have much to say about the substance of the article because most of it is an argument against something called "Bayesian methods" that doesn't have much in common with the Bayesian data analysis that I do.
If an quantitative, empirically-minded economist at a top university doesn't know about modern Bayesian methods, then it's a pretty good guess that confusion holds in many other quarters as well, so I thought I'd try to clear a couple of things up. (See also here.)
In the short term, I know I have some readers at the University of Michigan, so maybe a couple of you could go over to Prof. DiNardo's office and discuss this with him? For the rest of you, please spread the word.
My point here is not to claim that DiNardo should be using Bayesian methods or to claim that he's doing anything wrong in his applied work. It's just that he's fighting against a bunch of ideas that have already been discredited, within Bayesian statistics. It's all well and good to shoot at arguments that are already dead, but I think it's also a good idea to be aware of the best and most current work in a field that you're criticizing.
To be specific, see pages 7-8 of DiNardo's article:
1. DiNardo thinks that Bayesians believe that the data generating mechanism is irrelevant to inference. To which I reply, (a) I'm a Bayesian and I believe that the data generating is relevant to inference, and (b) We discuss this in detail in chapter 7 of BDA.
2. DiNardo thinks that stopping rules are irrelevant to Bayesians. Nope. see the example starting in the middle of page 163 in BDA (all references here are to the second edition).
3. DiNardo thinks that Bayesians think that the problem of "how to reason" has been solved. Nope. A Bayesian inference is only as good as its models. Bayesians are busy developing, applying, checking, and extending new classes of models. Consider, for example, the explosion of research in nonparametric Bayes in recent years. Given that "how to reason Bayesianly" includes model specification, and given that model specification is wide open, we would not at all claim that the problem of reasoning has been solved.
4. DiNardo thinks that Bayesians think that "usual (non-Bayesian) practice is very badly wrong." Sometimes it is, sometimes not. See BDA and ARM for lots of examples. And see here for some inferences that would be difficult to do using classical inference. (I'm not saying it can't be done, just that it would require a lot of effort, just to reproduce something that can be done straightforwardly using Bayesian methods.)
5. DiNardo thinks that Bayesians think that "randomization rarely makes sense in those contexts where it is most often employed." Nope. Forget Urbach (1985), whoever he is. Instead, check out section 7.6 of BDA.
6. DiNardo thinks that Bayesians think that "probability does not exist." Nope. Check out chapter 1 of BDA, in particular the examples of calibrations of record linkage and football point spreads.
The paradox of philosphizing
DiNardo remarks, perhaps accurately, that the literature on the philosophy of statistics is dominated by Bayesians with extreme and often nutty views. And this frustrates him. But here's the deal: A lot of the good stuff is not explicitly presented as philosophy.
When we wrote Bayesian Data Analysis, we were careful not to include the usual philosophical arguments that were at that time considered standard in any Bayesian presentation. We decided to skip the defensiveness and just jump straight to the models and the applications. This worked well, I think, but it has led the likes of John DiNardo and Chris Burdzy (as discussed earlier on this blog) to not notice the philosophical content that is there.
And this is the paradox of philosophizing. If we had put 50 or 100 pages of philosophy into BDA (rather than discussing model checking, randomization, the limited range of applicability of the likelihood principle, etc., in separate places in the book), that would've been fine, but then we would've diluted our message that Bayesian data analysis is about what works, not about what is theoretically coherent. Many people find philosophical arguments to be irritating and irrelevant to practice. Thus, to get to the point, it can be a good idea to avoid the philosophical discussions. But, as the saying goes, if philosophy is outlawed, only outlaws will do philosophy. DiNardo is responding to the outlaws. I hope this blog will wake him up and make him see the philosophy that is all around him every day.
Continue reading Ya don't know Bayes, Jack.
I was stunned this from Jenny Davidson about mystery writers:
The crime fiction community is smart and adult and welcoming, and so many good books are being written (Lee Child was mentioning his peer group - i.e. they were the new kids around the same tie - being Michael Connelly, Robert Crais, Dennis Lehane, Laura Lippman - the list speaks for itself) . . .
Why was I stunned? Because just a few days earlier I had a look at a book by Robert Crais. It just happened that Phil, when he was visiting, had finished this book (which he described as "pretty good") and left it with me so he wouldn't have to take it back with him. I'd never heard of Crais, but it had pretty amazing blurbs on the cover and Phil recommended it, so I took a look.
It was bad. From page 1 it was bad. It was like a bad cop show. I could see the seams where the sentences were stitched together. I could see how somebody might like this sort of book, but I certainly can't understand the blurbs or the idea that it's a "good book"!
Continue reading Whassup with those crappy thrillers?.
John Sides reports on a paper by Benjamin Page and Lawrence Jacobs about so-called deliberative forums, in particular a set of meetings called America Speaks that have been organized and conducted by the Peter G. Peterson Foundation, an organization formed by the former advertising executive, Secretary of Commerce, and investment banker to focus attention on the national debt.
Sides, Page, and Jacobs discuss three key points:
Continue reading Advocacy in the form of a "deliberative forum".
Kevin Bryan wrote:
I read your new article on deduction/induction under Bayes. There are a couple interesting papers from economic decision theory which are related that you might find interesting.
Continue reading More on Bayesian deduction/induction.
Bill Harris writes with two interesting questions involving time series analysis:
Continue reading Sampling rate of human-scaled time series.
Here's an article that I believe is flat-out entertaining to read. It's about philosophy, so it's supposed to be entertaining, in any case.
Here's the abstract:
A substantial school in the philosophy of science identifies Bayesian inference with inductive inference and even rationality as such, and seems to be strengthened by the rise and practical success of Bayesian statistics. We argue that the most successful forms of Bayesian statistics do not actually support that particular philosophy but rather accord much better with sophisticated forms of hypothetico-deductivism. We examine the actual role played by prior distributions in Bayesian models, and the crucial aspects of model checking and model revision, which fall outside the scope of Bayesian confirmation theory. We draw on the literature on the consistency of Bayesian updating and also on our experience of applied work in social science.Clarity about these matters should benefit not just philosophy of science, but also statistical practice. At best, the inductivist view has encouraged researchers to fit and compare models without checking them; at worst, theorists have actively discouraged practitioners from performing model checking because it does not fit into their framework.
Here's the background:
Continue reading Philosophy and the practice of Bayesian statistics.
Helen DeWitt links to an interview with Seth Godin, who makes some commonplace but useful observations on jobs and careers. It's fine, but whenever I read this sort of thing, I get annoyed by the super-aggressive writing style. These internet guys--Seth Godin, Clay Shirky, Philip Greenspun, Jeff Jarvis, and so on--are always getting in your face, telling you how everything you thought was true was wrong. Some of the things these guys say are just silly (for example, Godin's implication that Bob Dylan is more of a success than the Monkees because Dylan sells more tickets), other times they have interesting insights, but reading any of them for awhile just sets me on edge. I can't take being shouted at, and I get a little tired of hearing over and over again that various people, industries, etc., are dinosaurs.
Where does this aggressive style come from? My guess is that it's coming from the vast supply of "business books" out there. These are books that are supposed to grab you by the lapel and never let go.
I'm certainly not trying to tell Seth Godin and the others to change--a lot of people (for example, Helen DeWitt!) seem to like their style, and it seems to work for them. I just wanted to comment on this because I suddenly realized I was seeing this in-your-face, change-or-die style all over the place and it was getting annoying.
Perhaps I'll write a blog entry in this style at some point, just to see how it comes out.
P.S. I went to the library the other day and say their shelves and shelves of business books. Scary stuff.
Christian Robert is planning a graduate seminar in which students read 15 classic articles of statistics. (See here for more details and a slightly different list.)
Actually, he just writes "classics," but based on his list, I assume he only wants articles, not books. If he wanted to include classic books, I'd nominate the following, just for starters:
- Fisher's Statistical Methods for Research Workers
- Snedecor and Cochran's Statistical Methods
- Kish's Survey Sampling
- Box, Hunter, and Hunter's Statistics for Experimenters
- Tukey's Exploratory Data Analysis
- Cleveland's The Elements of Graphing Data
- Mosteller and Wallace's book on the Federalist Papers.
Probably Cox and Hinkley, too. That's a book that I don't think has aged well, but it seems to have had a big influence.
I think there's a lot more good and accessible material in these classic books than in the equivalent volume of classic articles. Journal articles can be difficult to read and are typically filled with irrelevant theoretical material, the kind of stuff you need to include to impress the referees. I find books to be more focused and thoughtful.
Accepting Christian's decision to choose articles rather than books, what would be my own nominations for "classics of statistics"? To start with, there must be some tradeoff between quality and historical importance.
One thing that struck me about the list supplied by Christian is how many of these articles I would definitely not include in such a course. For example, the paper by Durbin and Watson (1950) does not seem at all interesting to me. Yes, it's been influential, in that a lot of people use that statistical test, but as an article, it hardly seems classic. Similarly, I can't see the point of including the paper by Hastings (1970). Sure, the method is important, but Christian's students will already know it, and I don't see much to be gained by reading the paper. I'd recommend Metropolis et al. (1953) instead. And Casella and Strawderman (1981)? A paper about minimax estimation of a normal mean? What's that doing on the list??? The paper is fine--I'd be proud to have written it, in fact I'd gladly admit that it's better than 90% of anything I've ever published--but it seems more of a minor note than a "classic." Or maybe there's some influence here of which I'm unaware. And I don't see how Dempster, Laird, and Rubin (1977) belongs on this list. It's a fine article and the EM algorithm has been tremendously useful, but, still, I think it's more about computation than statistics. As to Berger and Sellke (1987), well, yes, this paper has had an immense influence, at least among theoretical statisticians--but I think the paper is basically wrong! I don't want to label a paper as a classic if it's sent much of the field in the wrong direction.
For other papers on Christian's list, I can see the virtue of including in a seminar. For example, Hartigan and Wong (1979), "Algorithm AS 136: A K-Means Clustering Algorithm." The algorithm is no big deal, and the idea of k-means clustering is nothing special. But it's cool to see how people thought about such things back then.
And Christian also does include some true classics, such as Neyman and Pearson's 1933 paper on hypothesis testing, Plackett and Burnham's 1946 paper on experimental design, Pitman's 1939 paper on inference (I don't know if that's the best Pitman paper to include, but that's a minor issue), Cox's hugely influential 1972 paper on hazard regression, Efron's bootstrap paper, and classics by Whittle and Yates. Others I don't really feel so competent to judge (for example, Huber (1985) on projection pursuit), but it seems reasonable enough to include them on the list.
OK, what papers would I add? I'll list them in order of time of publication. (Christian used alphabetical order, which, as we all know, violates principles of statistical graphics.)
Neyman (1935). Statistical problems in agricultural experimentation (with discussion). JRSS. This one's hard to read, but it's certainly a classic, especially when paired with Fisher's comments in the lively discussion.
Tukey (1972). Some graphic and semigraphic displays. This article, which appears in a volume of papers dedicated to George Snedecor, is a lot of fun (even if in many ways unsound).
Akaike (1973). Information theory and an extension of the maximum likelihood principle. From a conference proceedings. I prefer this slightly to Mallows's paper on Cp, written at about the same time (but I like the Mallows paper too).
Lindley and Smith (1972). Bayes estimates for the linear model (with discussion). JRSS-B. The methods in the paper are mostly out of date, but it's worth it for the discussion (especially the (inadvertently) hilarious contribution of Kempthorne).
Rubin (1976). Inference and missing data. Biometrika. "Missing at random" and all the rest.
Wahba (1978). Improper priors, spline smoothing and the problem of guarding against model errors in regression. JRSS-B. This stuff all looks pretty straightforward now, but maybe not so much so back in 1978, back when people were still talking about silly ideas such as "ridge regression." And it's good to have all these concepts in one place.
Rubin (1980). Using empirical Bayes techniques in the law school validity studies (with discussion). JASA. Great, great stuff, also many interesting points come up in the discussion. If you only want to include one Rubin article, keep this one and leave "Inference and missing data" for students to discover on their own.
Hmm . . . why are so many of these from the 1970s? I'm probably showing my age. Perhaps there's some general principle that papers published in year X have the most influence on graduate students in year X+15. Anything earlier seems simply out of date (that's how I feel about Stein's classic papers, for example; sure, they're fine, but I don't see their relevance to anything I'm doing today, in contrast to the above-noted works by Tukey, Akaike, etc., which speak to my current problems), whereas anything much more recent doesn't feel like such a "classic" at all.
OK, so here's a more recent classic:
Imbens and Angrist (1994). Identification and estimation of local average treatment effects. Econometrica.
Finally, there are some famous papers that I'm glad Christian didn't consider. I'm thinking of influential papers by Wilcoxon, Box and Cox, and zillions of papers of that introduced particular hypothesis tests (the sort that have names that they tell you in a biostatistics class). Individually, these papers are fine, but I don't see that students would get much out of reading them. If I was going to pick any paper of that genre, I'd pick Deming and Stephan's 1940 article on iterative proportional fitting. I also like a bunch of my own articles, but there's no point in mentioning them here!
Any other classics you'd like to nominate (or places where you disagree with me)?
A NY Times Environment blog entry summarizes an article in Proceedings of the National Academy of Sciences that looks into whether there really is a "scientific consensus" that humans are substantially changing the climate. There is. That's pretty much "dog bites man" as far as news is concerned. But although the results of the study don't seem noteworthy, I was struck by this paragraph in the blog writeup, which is pretty much a quote of the PNAS article:
For example, of the top 50 climate researchers identified by the study (as ranked by the number of papers they had published), only 2 percent fell into the camp of climate dissenters. Of the top 200 researchers, only 2.5 percent fell into the dissenter camp. That is consistent with past work, including opinion polls, suggesting that 97 to 98 percent of working climate scientists accept the evidence for human-induced climate change.
Two percent of the top 50, that's one person. And 2.5 percent of the top 200, that's five people. As a general rule, when the numerator in count data is very small, or when the denominator is fairly small, I prefer to see the numerator and denominator separately rather than a percentage. If someone says "this guy has been making more than 80% of his free throws this post season," I want to know if that is 6/7 or 17/20. So I think they should say 1/50 and 5/200, rather than 2% of the top 50 and 2.5% of the top 200. Yes, I understand these are mathematically identical, but I betcha a lot of people see "2% of 50" and don't realize that's one person, even though they'd realize it if they thought about it for just a second.
By the way, one guy (I assume it's a guy, most of them are guys) has over 850 climate-related publications. Fourteen people have over 500 publications each (one of these is the "dissenter" among the top 50). Jeez. Andrew might attain this sort of level if he keeps up as his current rate, but for most of the rest of us this is ridiculous. Quite a selection effect, too: it'd be pretty much impossible to be considered as one of their "top 50" climate experts if you are under 45 years old.
Lucy Flynn writes:
I'm working at a non-profit organization called CRRC in the Republic of Georgia.
Continue reading PPS in Georgia.
Maggie Fox writes:
Brain scans may be able to predict what you will do better than you can yourself . . . They found a way to interpret "real time" brain images to show whether people who viewed messages about using sunscreen would actually use sunscreen during the following week.The scans were more accurate than the volunteers were, Emily Falk and colleagues at the University of California Los Angeles reported in the Journal of Neuroscience. . . .
About half the volunteers had correctly predicted whether they would use sunscreen. The research team analyzed and re-analyzed the MRI scans to see if they could find any brain activity that would do better.
Activity in one area of the brain, a particular part of the medial prefrontal cortex, provided the best information.
"From this region of the brain, we can predict for about three-quarters of the people whether they will increase their use of sunscreen beyond what they say they will do," Lieberman said.
"It is the one region of the prefrontal cortex that we know is disproportionately larger in humans than in other primates," he added. "This region is associated with self-awareness, and seems to be critical for thinking about yourself and thinking about your preferences and values."
Hmm . . . they "analyzed and re-analyzed the scans to see if they could find any brain activity" that would predict better than 50%?! This doesn't sound so promising. But maybe the reporter messed up on the details . . .
I took advantage of my library subscription to take a look at the article, "Predicting Persuasion-Induced Behavior Change from the Brain," by Emily Falk,Elliot Berkman,Traci Mann, Brittany Harrison, and Matthew Lieberman. Here's what they say:
- "Regions of interest were constructed based on coordinates reported by Soon et al. (2008) in MPFC and precuneus, regions that also appeared in a study of persuasive messaging." OK, so they picked two regions of interest ahead of time. They didn't just search for "any brain activity." I'll take their word for it that they just looked at these two, that they didn't actually look at 50 regions and then say they reported just two.
- Their main result had a t-statistic of 2.3 (on 18 degrees of freedom, thus statistically significant at the 3% level) in one of the two regions they looked at, and a t-statistic of 1.5 (not statistically significant) in the other. A simple multiple-comparisons correction takes the p-value of 0.03 and bounces it up to an over-the-threshold 0.06, which I think would make the result unpublishable! On the other hand, a simple average gives a healthy t-statistic of (1.5+2.3)/sqrt(2) = 2.7, although that ignores any possible correlation between the two regions (they don't seem to supply that information in their article).
- They also do a cross-validation but this seems 100% pointless to me since they do the cross-validation on the region that already "won" on the full data analysis. For the cross-validation to mean anything at all, they'd have to use the separate winner on each of the cross-validatory fits.
- As an outcome, they use before-after change. They should really control for the "before" measurement as a regression predictor. That's a freebie. And, when you're operating at a 6% significance level, you should take any freebie that you can get! (It's possible that they tried adjusting for the "before" measurement and it didn't work, but I assume they didn't do that, since I didn't see any report of such an analysis in the article.)
The bottom line
I'm not saying that the reported findings are wrong, I'm just saying that they're not necessarily statistically significant in the usual way this term is used. I think that, in the future, such work would be improved by more strongly linking the statistical analysis to the psychological theories. Rather than simply picking two regions to look at, then taking the winner in a study of n=20 people, and going from there to the theories, perhaps they could more directly model what they're expecting to see.
The difference between . . .
Also, the difference between "significant'' and "not significant'' is not itself statistically significant. How is this relevant in the present study? They looked at two regions, MPFC and precuneus. Both showed positive correlations, one with a t-value of 2.3, one with a t-value of 1.5. The first of these is statistically significant (well, it is, if you ignore that it's the maximum of two values), the second is not. But the difference is not anything close to statistically significant, not at all! So why such a heavy emphasis on the winner and such a neglect of #2?
Here's the count from a simple document search:
MPFC: 20 instances (including 2 in the abstract)
precuneus: 8 instances (0 in the abstract)
P.S. The "picked just two regions" bit gives a sense of why I prefer Bayesian inference to classical hypothesis testing. The right thing, I think, is actually to look at all 50 regions (or 100, or however many regions there are) and do an analysis including all of them. Not simply picking the region that is most strongly correlated with the outcome and then doing a correction--that's not the most statistically efficient thing to do, you're just asking, begging to be overwhelmed by noise)--but rather using the prior information about regions in a subtler way than simply picking out 2 and ignoring the other 48. For example, you could have a region-level predictor which represents prior belief in the region's importance. Or you could group the regions into a few pre-chosen categories and then estimate a hierarchical model with each group of regions being its own batch with group-level mean and standard deviation estimated from data. The point is, you have information you want to use--prior knowledge from the literature--without it unduly restricting the possibilities for discovery in your data analysis.
Near the end, they write:
In addition, we observed increased activity in regions involved in memory encoding, attention, visual imagery, motor execution and imitation, and affective experience with increased behavior change.
These were not pre-chosen regions, which is fine, but at this point I'd like to see the histogram of correlations for all the regions, along with a hierarchical model that allows appropriate shrinkage. Or even a simple comparison to the distribution of correlations one might expect to see by chance. By suggesting this, I'm not trying to imply that all the findings in this paper are due to chance; rather, I'm trying to use statistical methods to subtract out the chance variation as much as possible.
P.P.S. Just to say this one more time: I'm not at all trying to claim that the researchers are wrong. Even if they haven't proven anything in a convincing way, I'll take their word for it that their hypothesis makes scientific sense. And, as they point out, their data are definitely consistent with their hypotheses.
P.P.P.S. For those who haven't been following these issues, see here, here, here, and here.
A few months ago, I blogged on John Gottman, a psychologist whose headline-grabbing research on marriages (he got himself featured in Blink with a claim that he could predict with 83 percent accuracy whether a couple would be divorced--after meeting with them for 15 minutes!) was recently debunked in a book by Laurie Abraham.
The question I raised was: how could someone who was evidently so intelligent and accomplished--Gottman, that is--get things so wrong? My brief conclusion was that once you have some success, I guess there's not much of a motivation to change your ways. Also, I could well believe that, for all its flaws, Gottman's work is better than much of the other research out there on marriages. There's still the question of how this stuff gets published in scientific journals. I haven't looked at Gottman's articles in detail and so don't really have thoughts on that one.
Anyway, I recently corresponded with a mathematician who had heard of Gottman's research and wrote that he was surprised by what Abraham had found:
The commenting feature doesn't work for me on Helen DeWitt's blog so I'm forced to comment on her entries here.
1. She discusses whether it's fair to characterize The Last Samurai. I have a slightly different perspective on this: I've never really understood the idea that a "beach read" should be something light and fluffy. On the beach, you can relax, you have the time to get into anything. I could see wanting something light on the subway--you have to be able to get into it right away and follow it amid all the jostles. I guess the point is that when you're at the beach, you're far from the library. So what you really want for the beach is not necessarily something relaxing or easy to read, but rather a sure thing, a known quantity that you'll definitely enjoy. No point sitting on the beach reading a book that you hate.
2. In an interesting discussion of translation, DeWitt recommends learning a language by reading great literature in the original tongue. Seems fine to me . . . but, I gotta admit that I think of pleasure reading (even serious stuff) as a way to relax. For me, reading a novel (or even the newspaper) in French or Spanish is a substitute for work, not a substitute for bedtime reading.
3. Apparently many people use tax-preparation software, even though tax forms aren't really hard to fill out. One thing I'll say in encouragement of doing your own taxes is that I used to do my own taxes and every once in awhile I'd make a mistake, but . . . it wasn't so horrible! I'd just send the government a check for what I owed and there'd be a little fine. No big deal. Sometimes I'd overpay by mistake and they'd send me a refund check. I can't guarantee this will happen to you, but those were my experiences.
I'm trying to temporarily kick the blogging habit as I seem to be addicted. I'm currently on a binge and my plan is to schedule a bunch of already-written entries at one per weekday and not blog anything new for awhile.
Yesterday I fell off the wagon and posted 4 items, but maybe now I can show some restraint.
P.S. In keeping with the spirit of this blog, I scheduled it to appear on 13 May, even though I wrote it on 15 Apr. Just about everything you've been reading on this blog for the past several weeks (and lots of forthcoming items) were written a month ago. The only exceptions are whatever my cobloggers have been posting and various items that were timely enough that I inserted them in the queue afterward.
P.P.S I bumped it up to 22 Jun because, as of 14 Apr, I was continuing to write new entries. I hope to slow down soon!
P.P.P.S. (20 June) I was going to bump it up again--the horizon's now in mid-July--but I thought, enough is enough!
Right now I think that about half of my posts are topical, appearing within a couple days of posting--I often write them in the evening but I like to have them appear between 9 and 10am, eastern time--and half are on a longer delay.
This looks cool:
Ten years ago researchers in America took two groups of three-year-olds and showed them a blob of paint on a canvas. Children who were told that the marks were the result of an accidental spillage showed little interest. The others, who had been told that the splodge of colour had been carefully created for them, started to refer to it as "a painting".Now that experiment . . . has gone on to form part of the foundation of an influential new book that questions the way in which we respond to art. . . . The book, which is subtitled The New Science of Why We Like What We Like, is not an attack on modern or contemporary art and Bloom says fans of more traditional art are not capable of making purely aesthetic judgments either. "I don't have a strong position about the art itself," he said this weekend. "But I do have a strong position about why we actually like it."
This sounds fascinating. But I'm skeptical about this part:
Humans are incapable of just getting pleasure from the way something looks, he [Paul Bloom, the author of the book described above] argues.
What is it about art that makes people say such silly things? This above sentence is not a direct quote from Bloom, though, so maybe it's just a misunderstanding coming from Vanessa Thorpe, the author of the above-quoted news article.
There are a few more contradictions floating around here. As noted above, at one point, Thorpe writes:
The book . . . is not an attack on modern or contemporary art and Bloom says fans of more traditional art are not capable of making purely aesthetic judgments either.
But look later on:
"Traditional art is about what is in the world; more modern works are about the very process of representation," he writes. "An appreciation of much of modern art therefore requires specific expertise. Any dope can marvel at a Rembrandt, but only an elite few can make any sense of a work such as Sherrie Levine's Fountain (After Marcel Duchamp), and so only an elite few are going to enjoy it . . . Any schmoe can buy, and appreciate, a pretty painting. . ."
I wonder if the author of this book (and the author of the news article) have read Tom Wolfe's The Painted Word, which tells a story that's pretty coherent to me. I worry about the circularity of defining modern art as abstract stuff that's hard to follow. To me this seems to have a lot more to do with the history of the academic/museum art world in the 20th century than with psychological perceptions of art.
I'd really hate to generalize from statements about Jackson Pollock (whose "drip" paintings I, personally, see no merit in whatsoever, but, hey, that's just me talking here) to claims that "humans are incapable of just getting pleasure from the way something looks." I'm hoping to go to Lascaux in August (yeah, I know, they don't let you into the real Lascaux, but the tour guides say that the fake one nearby is pretty good) so can report back to you then.
In the meantime, the psychology research looks great, and I suppose the author of an academic book can hardly complain if an overwhelmingly positive newspaper article gets a few things wrong. I'm looking forward to reading the book myself, that's for sure.
Derek Sonderegger writes:
I have just finished my Ph.D. in statistics and am currently working in applied statistics (plant ecology) using Bayesian statistics. As the statistician in the group I only ever get the 'hard analysis' problems that don't readily fit into standard models. As I delve into the computational aspects of Bayesian analysis, I find myself increasingly frustrated with the current set of tools. I was delighted to see JAGS 2.0 just came out and spent yesterday happily playing with it.My question is, where do you see the short-term future of Bayesian computing going and what can we do to steer it in a particular direction?
Continue reading "People with an itch to scratch".

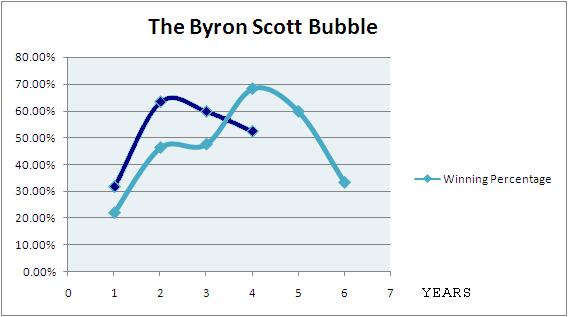
Books


Recent Comments