Results matching “R”

Teaching Example

There was a fun little article in the New York Times a while back (unfortunately I can't find it now and am missing some of the numbers, but the main idea still holds) about income differences across New York City's five boroughs. Apparently the mean income in the Bronx is higher than in Brooklyn, even though Brooklyn has a smaller proportion of residents below the poverty line, higher percentage of homeowners, and lower unemployment. Why is income higher in the Bronx, then? The reason, according to the article, is the New York Yankees--Yankees' salaries are so high that they make the whole borough look richer than it is.

(I'm not sure exactly how these income figures were calculated, since most of the Yankees probably don't actually live in the Bronx, but let's ignore that.) Obviously one should be comparing medians rather than means, which is where the teaching example comes in. I told my regression students this story last semester and someone asked about Queens, but I don't think the Mets' payroll even comes close to that of the Yankees (who, by the way, are a game behind the Red Sox).

Lying with Statistics

I hope I'm not just contributing to the gossip mill, but the latest post on the Freakonomics blog is kind scary.

Terrorism and Statistics

There was an interesting editorial in Sunday's New York Times about the anxiety produced by terrorism and people's general inability to deal rationally with said anxiety. All kinds of interesting stuff that I didn't know or hadn't thought about. Nassim Nicholas Taleb, a professor at UMass Amherst, writes that risk avoidance is governed mainly by emotion rather than reason, and our emotional systems tend to work in the short term: fight or flight; not fight, flight, or look at the evidence and make an informed decision based on the likely outcomes of various choices. Dr. Taleb points out that Osama bin Laden "continued killing Americans and Western Europeans in the aftermath of Sept. 11": People flew less and drove more, and the risk of death in an automobile is higher than the risk in an airplane. If you're afraid of an airplane hijacking, though, you're probably not thinking that way. It would be interesting to do a causal analysis of the effect of the September 11 terrorist attacks on automobile deaths (maybe someone already has?).

3 Books

One of the more memorable questions I was asked when on the job market last year was "If you were stranded on a deserted island with only three statistics books, what would they be?". (I'm not making this up.) If I were actually in that incredibly unlikely and bizarre situation, the best thing would probably be to just choose the three biggest books out there, in case I needed them for a fire or something. I'm pretty sure there's no tenure clock on deserted islands. But I digress. What I said was:

1. Gelman, Carlin, Stern, and Rubin (Bayesian Data Analysis)
2. The Rice Book (Mathematical Statistics and Data Analysis, John Rice)
3. Muttered something about maybe a survey sampling book and quickly changed the subject.

If anyone ever asks me that again, I think I'll change Number 3 to Cox's The Planning of Experiments.

Pet Peeve

I was reading an article in the newspaper the other day (I think it was about Medicare fraud in New York state, but it doesn't really matter) that presented some sort of result obtained from a "computer analysis." A computer analysis? Regression analysis, even statistical or economic analysis, would give at least some vague notion of what was done, but the term computer analysis is about as uninformative as saying that the analysis was done inside an office building. It's sort of like saying you analyzed data using Gibbs sampling, as opposed to saying what the model was that the Gibbs sampler was used to fit. Not untrue, but pretty uninformative.

A cool way to summarize a basketball player's contribution to his team is the plus-minus statistic or "Roland rating," which is "the difference in how the team plays with the player on court versus performance with the player off court."

I had heard of this somewhere and found the details searching on the web, via this page of links on basketball statistics, which led me to Kevin Pelton's statistical analysis primer, which led me to this page by Dan Rosenbaum. I had been wondering if the plus-minus statistic could be improved by adjusting for the qualities of the other players and teams on the court, and Rosenbaum has done just that.

I have a further thought, which is to apply a multilevel model to be able to handle thinner slices of the data. The issue is that, unless sample sizes are huge, the adjustments for the abilities of other players and other teams will be noisy. Multilevel modeling should help smooth out this variation and allow for adjusting for more factors, or for adjusting for the same factors for shorter time intervals. Sort of like the work of Val Johnson on adjusting grade point averages for the different abilities of students taking different courses.

Jeff Fagan forwarded this article on gun violence by Jeffrey Bingenheimer, Robert Brennan, and Felton Earls. The research looks at children in Chicago who were exposed to gun violence, and uses propensity score matching to find a similar group who were unexposed. Their key finding: "Results indicate that exposure to firearm violence approximately doubles the probability that an adolescent will perpetrate serious violence over the subsequent 2 years."

I'll first give a news report summarizing the article, then my preliminary thoughts.

Here's the summary:

Bryan Caplan writes about a cool paper from 1999 by Philip Tetlock on overconfidence in historical predictions. Here's Caplan's summary:

Tetlock's piece explores the overconfidence of foreign policy experts on both historical "what-ifs" ("Would the Bolshevik takeover have been averted if World War I had not happened?") and actual predictions ("The Soviet Union will collapse by 1993.") The highlights:

# Liberals believe that relatively minor events could have made the Soviet Union a lot better; conservatives believe that relatively minor events could have made South Africa a lot better.

# Tetlock asked experts how they would react if a research team announced the discovery of new evidence. He randomly varied the slant of the evidence. He found a "pervasiveness of double standards: experts switched on the high-intensity search light of skepticism only for dissonant results."

# Tetlock began collecting data on foreign policy experts' predictions back in the 80's. For example, in 1988 he asked Sovietologists whether the USSR would still be around in 1993. Overall, experts who said they were 80% or more certain were in fact right only 45% of the time.

# How did experts cope with their failed predictions? "[F]orecasters who had greater reason to be surprised by subsequent events managed to retain nearly as much confidence in the fundamental soundness of their judgments of political causality as forecasters who had less reason to be surprised." The experts who made mistakes often announced that it didn't matter because prediction is pretty much impossible anyway (but then why did they assign high probabilities in the first place?!) The mistaken experts also often said they were "almost right" (e.g. the coup against Gorbachev could have saved Communism) but correct experts very rarely conceded that they were "almost wrong" for similar reasons.

Caplan goes on to discuss the probability that forecasters might have been more calibrated if they had been betting money on their predictions. This is an interesting point but I'd like to take the discussion in a different direction. Beyond the general interest in cognitive illusions I've had since reading the Kahneman, Slovic, and Tversky book way back when, Tetlock's study interests me because it interacts with Niall Ferguson's work on potential outcomes in historical studies and Joe Bafumi's work on the stubborn American voter.

Virtual history and stubborn voters

Ferguson edited a book on "virtual history" in which he considered historical speculations, and retroactive historical speculations, in the potential-outcome framework that is used in statistical inference. These ideas also come up in other fields, such as law (as pointed out here by Don Rubin). I'm not quite sure how overconfidence fits in here but it seems relevant.

Joe Bafumi in the "stubborn American voter" (here's an old link; I don't have a link to the updated version of the paper) found that in the past twenty years or so, Americans have become more partisanl, not only in their opinions, but also in their views on factual matters. This seems similar to what Tetlock found and also suggests that the time dimension is relevant. Joe also considers views of elites vs. average Americans.

Finally . . .

Tetlock's paper was great but I'd like it even better if the results were presented as graphs rather than tables of numbers. In my experience, graphical presentations make results clearer, but even more important, can generate new hypotheses and reject existing hypotheses I didn't realize I had.

My impression is that statistics and data analysts see graphics as an "exploratory" tool for looking at data, maybe useful when selecting a model, but then when they get their real results, they present the numbers. But in my conception of exploratory data analysis (see also here for Andreas Buja's comment and here for my rejoinder), graphs are about comparisons. And, as is clear from Caplan's summary, Tetlock's paper is all about comparisons--stated probabilities compared to actual probabilities, liberals compared to conservatives, and so on. So I think something useful could possibly be learned by re-expressing Tetlock's Tables 1, 2, 3, and 4 as graphs. (Perhaps a good term project for a student in my regression and multilvel modeling class this fall?)

Following up on medical studies

From Mahalanobis, a link to a story following up on medical research findings. From the CNN.com article:

New research highlights a frustrating fact about science: What was good for you yesterday frequently will turn out to be not so great tomorrow.

The sobering conclusion came in a review of major studies published in three influential medical journals between 1990 and 2003, including 45 highly publicized studies that initially claimed a drug or other treatment worked.

Subsequent research contradicted results of seven studies -- 16 percent -- and reported weaker results for seven others, an additional 16 percent.

That means nearly one-third of the original results did not hold up, according to the report in Wednesday's Journal of the American Medical Association.

This is interesting, but I'd like to hear more. If we think of effects as being continuous, then I'd expect that "subsequent research" would find stronger results half the time, and weaker results the other half the time. I imagine their dividing line relates to statistical significance, but that criterion can be misleading when making comparisons.

I'm not saying there's anything wrong with this JAMA article, just that I'd like to see more to understand what exactly they found. They do mention as an example the notorious post-menapausal hormone study.

P.S. For the name-fans out there, the study is by "Dr. John Ioannidis, a researcher at the University of Ioannina." I wonder if having the name helped him get the job.

Here's another one from Chance News:

Red enhances human performance in contests

Chance News points us toward this list of statistical cliches in baseball:

New York Times, April 3, 2005, Section 8, Pg 10 Alan Schwarz

The author writes: with statistics courtesy of Stats Inc., the following is a user's guide to the facts behind seven statistical cliches. We [Chance News, that is] have included excerpts from his explanation and recommend reading his complete discussions.

(1) HAS A 75-6 RECORD WHEN LEADING AFTER EIGHT INNINGS

Teams leading after eight innings last year won about 95 percent of the time (translating to a 77-4 record in 81 games); that 75-6 record would be two full games worse than average. Even after seven innings, teams with leads typically win 90.1 percent of the time.

(2) HOLDS LEFTIES TO A .248 AVERAGE.

Middle relievers have become ever more important in baseball, particularly left-handed specialists who jog in to face only one or two left-handed hitters. Last year, left-handed middle relievers held fellow lefties to a .249 collective average, 18 points lower than the major league-wide .267 average in all other situations. Someone yielding a .248 average sounds good but is merely doing his job.

(3) HAS HIT 9 OF HIS LAST 12 GAMES

Last year, each game's starting position players finished with at least one hit 67.1 percent of the time. So across any 12-game stretch, simple randomness will have almost half of them hitting safely in eight or nine games. More than half will wind up with hits in eight or more.

(4) HAS 31 SAVES IN 38 OPPORTNITIES

Relievers who were considered closers converted saves 84.8 percent of the time last season -- 32 times for every 38 chances.

(5) HAS STOLEN 19 BASES IN 27 ATTEMPTS (70%)

Players batting first and second in their lineups, usually speedy table-setters, stole bases 73.7 percent of the time last season.

(6) LEADS N.L. ROOKIES WITH A .287 AVERAGE

Interesting, perhaps, but most people do not realize how few rookies play enough to be considered for this type of list. Last year, six rookies reached the standard cutoff of 502 plate appearances to qualify for the batting title.

(7) HITS .342 ON THE FIRST PITCH

The stat line many people use to make these claims reads on 0-0 counts What people do not realize is that on 0-0 counts includes only at-bats that end on the first pitch; in other words, the hitter put the ball in play. Removing every time a hitter swings through a pitch or fouls it off will make anyone look good.

I've seen some of these before but this presentation (by Alan Schwarz, edited by Chance News) is particularly crisp. I like how they don't just mock the "cliches"; they actually provide some data.

30 stories in 30 days

Andrea Siegel sent me this awhile ago--some stories about her experiences working in a chain bookstore in NYC. My favorites are #6, #11, #16, #17, and #24, but there's a pleasant total-immersion feeling from reading all of them.

My first 30 days at a mid-Manhattan bookstore
(c) 1999 Andrea Siegel. All rights reserved.

Commenting on my thoughts about decision analysis and Schroedinger's cat (see here for my clarifications), Dave Krantz writes,

I'd first like to comment on the cat example, and then turn to the relationship to probabilistic modelling of choice.

I think one can gain clarity by thinking about simpler analogs to Schroedinger's cat. Instead of poison gas being released, killing the cat, let's suppose that a single radioactive decay just releases one molecule of hydrogen (H2) into an otherwise empty (hard vacuum) cat box. Now an H2 molecule is something that, in principle, one can describe pretty well by a rather complicated wave function. The wave function for an H2 molecule confined to a small volume, however, is different from the wave function for an H2 molecule confined to a much larger cat box. At any point in time, our best description (vis-a-vis potential measurements we could make that would interact with the H2 molecule) is a superposition of these two wave functions, narrowly or broadly confined. As long as we don't know whether the radioactive decay has taken place, and we make no observation that directly or indirectly interacts with the H2 molecule, the superposition continues to be the best physical model.

This example points up the fact that Schroedinger's cat involves two different puzzles. The first is epistemological: we are used to thinking of a cat as alive or dead, but equally used to thinking of a H2 molecule as confined narrowly or broadly. How can it be both? But this way of thinking just won't work in QM. The point of the double-slit experiments is to show clearly that an unobserved photon does NOT go through one slit or the other, it goes through both, in the sense of its wave function giving rise to coherent circularly symmetric waves emanating from each slit and interfering. It is equally wrong to think that a H2 molecule is either confined narrowly or broadly. Observations are going to be accounted for by assuming a superposition.

The second puzzle arises because a cat cannot in practice be described by a single wave function at all. That's at least true of an ordinary cat, subject to many sorts of observation. But in practice, even an unobserved cat is not describable by a wave function. There are wave functions for each molecule, but the best descriptions do not collapse these into a single wave function. Coherence fails. To take an analogy, one can get monochromatic light by passing a beam through an interference filter; though the frequencies of the different photons are all alike, the phases still vary randomly. This is very different from the coherent light of a laser, where everything is in phase.

There is a real problem of understanding when incoherent wave functions collapse into a single coherent one. This has been dramatized, in recent years, by studies of Bose-Einstein condensates. Rubidium atoms can be very near one another, yet still incoherent; but at low temperatures, they become a single molecular system, with a condensed wave function. The study of conditions for coherence is on-going, as I understand it. A cat is outside the boundaries of coherence.

Epistemologically, the introduction of probabilities as fundamental terms in choice modelling is rather analogous to the introduction of probabilities in QM measurement. It has always struck me as curious that the two happened in the same year, 1927: Born developed the probabilistic interpretation of QM measurement and Thurstone formulated the law of comparative judgment.

Where the analogy breaks down, however, is that there isn't any analog to a wave function in choice models. Thurstone actually tried to introduce something like it, with his discriminal processes, but from the start, discriminal processes were postulated to be independent rather than coherent random variables. Thus, I don't see much point in pushing the analogy of any DM problem with the Schroedinger cat problem, where the essence is superposition rather than independence.

My thoughts

OK, that was Dave talking. To address his last point, yes, I don't see where the complex wave function would come in. (Dsquared makes the same point in the comments to this entry. In probability theory we're all happy to use Boltzmann statistics (i.e., classical probability theory). I've never seen anyone make a convincing case (or even try to make a case) that, for example, Fermi-Dirac statistics should be used for making business decisions.)

But Dave's point above about "coherence" is exactly what I was talking about. Also there's the bit about the collapse of the wave function (or of the decision tree). But I suppose Dave would say that, without complex wavefunctions, there's no paradox there. With classical Boltzmann statistics, the cat really is just alive or dead all along, with no need for superposition of states

Jim Thompson's cat

Hmmm...my feeling is that the act of deliberation, or even just of keeping a decision "open" or "alive," creates a superposition of states. If I'm deciding whether or not to flip the switch, then I would't say that the cat is "either alive or dead." I haven't decided yet! In The Killer Inside Me, Jim Thompson writes, "How can you hurt someone that's already dead?", but I don't take such a fatalistic position.

Roger Penrose's consciousness

But hey, let's take this one step further. In my experiment (as opposed to Schroedinger's), the cat is alive or dead based on my decision of whether to flip a switch (and, in turn, this decision is ultimately coupled with other outcomes of interest; e.g., the switch also turns off the light in the next room, which encourages the lab assistant to go home for the day, and then he might bump into someone on the subway, etc., etc.). If it is true, as Penrose claims in The Emperor's New Mind, that consciousness is inherently quantum-mechanical and non-algorithmic, then my decision of whether to flip the switch indeed must be modeled as a superposition of wave functions. Although then I'm not quite sure how deliberation fits in to all this.

Anyway, to get more positivistic for a moment, maybe the next research step is to formulate some actual decision problems (or realistic-seeming fake problems) in terms of coherence, and see if anything useful comes of it.

P.S. Dave is very modest on his webpage but he's actually the deepest thinker I know of in decision analysis.

P.P.S. It's funny that Dave has a cat living in a "cat box," which I always thought was equivalent to the litterbox (so I recall from my catful days). Maybe "cat container" would be a better phrase?

Decision analysis, Penrose style

I appreciated the comments on my recent entry on decision analysis and Schroedinger's cat.

Some comments

Chris sent some general links, and Simon and Dsquared referred to some specific desicion problems in finance--an area I know nothing about but certainly seems like a place where formal decision analysis would be useful.

Deb referred to the expected value of information (a concept I remember from teaching classes in decision analysis) and wonders why I have to bring quantum mechanics and Roger Penrose into the picture.

Why bring in quantum mechanics?

I bring up quantum mechanics for two reasons. First, making a decision has the effect of discretizing a continuous world. (Just as, in politics, a winner-take-all election converts a divided populace into a unidirectional mandate.) I see a strong analogy here to the collapsing of the wave function. To bring in a different physics analogy, decision-making crystallizes a fluid world into a single frozen choice.

The second connection to quantum mechanics connection arises because decisions are not made in isolation, and when we wait on a decision, it tends to get "entangled" with other decisions, producing a garden of forking paths that is a challenge to analyze. At some point--even, possibly, before the "expected value of additional information" crosses the zero line--decisions get made, or decision-making gets forced upon us, because it's just to costly for all concerned to live with all the uncertainty. (I wouldn't say this is true of all decisions or even most decisions, but it can arise, especially I think in decisions which are loosely coupled to other decisions--for example, a business decision that affects purchasing, hiring in other divisions, planning, etc.) This is the Penrose connection--that quantum states (or decisions) get resolved when they are entangled with enough mass.

P.S.

The other thing I learned is that links don't always work. Chris sent me this link, Simon sent this, and Dsquared sent this. My success: 0/3. 1 broken link and 2 with password required.

Publicity

Seth writes,

Hi Andrew,

I probably have you to thank for the fact that the abstract of my long self-experimentation paper appears in this month's Harper's Readings. I remember meeting through you a woman who used to assemble that section. And maybe she still does. Did you tell her about my paper?

I first saw the excerpt in an airport bookstore at Midway airport. On the flight from Chicago to Oakland I was miraculously seated next to someone who had bought that issue. (Shouldn't the odds of that be very low?) She started reading it. She eventually got to my abstract. "I read that," I said to her. "What do you think of it?" "I don't know what to make of it," she said. "What did you think of it?" "I liked it," I said.

Seth

Nice story. By the way, I assume that the article came to the attention of Harper's through this blurb in Marginal Revolution rather than from Alexandra Ringe, who used to work at Harper's. (Here's my take on Seth's article.)

P.S. regarding Seth's question about the low odds. I was once in the Cleveland airport when I was paged. It was for a different "Andy Gelman." I remember years ago reading a book by the mathematician J. Littlewood that had something about the frequency of rare events in one's life. So I Googled "littlewood coincidences" and found this quote from Freeman Dyson:

Littlewood's Law of Miracles states that in the course of any normal person's life, miracles happen at a rate of roughly one per month. The proof of the law is simple. During the time that we are awake and actively engaged in living our lives, roughly for eight hours each day, we see and hear things happening at a rate of about one per second. So the total number of events that happen to us is about thirty thousand per day, or about a million per month. With few exceptions, these events are not miracles because they are insignificant. The chance of a miracle is about one per million events. Therefore we should expect about one miracle to happen, on the average, every month.

Also mentioned here in Chance News.

One of the mysteries of quantum mechanics (as I recall from my days as a physics major, and from reading Roger Penrose's books) is the jump from complex probability amplitudes to observed outcomes, and the relation between observation and measurement. Heisenberg, 2-slit experiment, and that cat that's both alive and dead, until it's observed, at which point it becomes either alive or dead. As I recall from reading The Emperor's New Mind, Penrose believed that it was not the act of measurement that collapsed the cat's wavefunction, but rather the cat's (or, more precisely, the original electron whose state was uncertain) getting entangled with enough mass that the two possibilities could not simulteously exist.

OK, fine. I haven't done any physics since 1986 so I can't comment on this. But it reminded me of something similar in decision making.

Consider a decision that must be made at some unspecified but approximately-known time in the future. For example, a drug company must choose which among a set of projects to pursue (and does not have the resources to pursue all of them). The choice needs not be made immediately, and waiting will allow more information to be gathered to make a more informed decision. At the same time, the clock is ticking and there are losses associated with delay. In addition to the obvious losses (not going full-bore on a promising project leads to a later expected release date, thus fewer lives saved and less money made), waiting ties up other resources of suppliers, customers, etc. [Yes, this example is artificial--I'm sure I can think of something better--but please bear with me on the general point.]

So this is the connection to quantum mechanics. We have a decision, which will ultimately either kill a cat or not, and it makes sense to keep the decision open as long as possible, but at some point it becomes entangled with enough other issues that the decision basically makes itself, or, to put it another way, the decision just has to be made. The act of decision is equivalent to taking a measurement in the physical experiment.

I think there's something here, although I'm not quite sure what.

P.S. Further discussion here.

The morphing poster

Reversals of death sentences

Jim Liebman pointed me toward this news article that referred to our study of the death-penalty appeals process. I'll briefly discuss our findings, then give the news article, then give my reactions to the news article.

Here's the abstract of our paper, which appeared last year in the Journal of Empirical Legal Studies:

We collected data on the appeals process for all death sentences in U.S. states between 1973 and 1995. The reversal rate was high, with an estimated chance of at least two-thirds that any death sentence would be overturned by a state or federal appeals court. Multilevel regression models fit to the data by state and year indicate that high reversal rates are strongly associated with higher death-sentencing rates and lower rates of apprehending and imprisoning violent offenders. In light of our empirical findings, we discuss potential remedies including "streamlining" the appeals process and restricting the death penalty to the "worst of the worst" offenders.

"Frivolous" reversals?

Section III of our paper discusses reasons for reversal in detail. We found that most of the reversals at these two review stages occurred where the correct outcome of the trial was in doubt; the reversing courts found that, if it had not been for the error, there was a "reasonable probability" that the outcome would have been different.

More broadly, there is no evidence that judges are systematically disposed to ignore or frustrate the public will on the death penalty. About 90 percent of the reversals in our study were by elected state judges—-who generally need the support of a majority of the voters in order to take or remain in office. Most of the remaining reversals were by federal judges appointed by Republican presidents with strong law-and-order agendas.

The Reuters article

Social networks in academia

Gueorgi Kossinets (a Ph.D. student in our collective dynamics group here at Columbia) forwarded this article on the role of social networks in faculty hiring.

This reminds me that Tian once told me that I had the reputation of writing lukewarm letters of recommendation. Of course, I was thrilled to have any reputation at all, but I wasn't so happy that the rep was of not being nice. After that, I consciously ratcheted up my letters. For a few years, my letters probably had extra impact until people learned to normalize.

But I don't want to go too far and become like the well-known statistician whose letters are always so uniformly positive that they get calibrated down to zero. Not enough data around to use formal statistical adjustment.

Jouni pointed me to this course on information visualization by Ross Ihaka (one of the original authors of R).

It looks great (and should be helpful for me in preparing my new course in statistical graphics next spring). My only complaint is that it focuses so strongly on techniques without any theoretical discussion of how graphical methods relate to statistical ideas such as model checking and exploratory data analysis. (This is a particular interest of mine.)

I'll have to look over the notes in detail to see what I can learn. I use pretty sloppy programming techniques to make my graphs--I always have to do a lot of hand-tuning to get them to look just how I want--and I think Ihaka's more systematic approach could be helpful.

In the meantime, a few picky comments

Extra time on the SAT?

Newmark's Door links to the following story by Samuel Abrams about scores on College Board exams where disabled students get extra time. Apparently, if you can convincingly demonstrate that you need "special accomodation," you can get extra time on the SAT. Abrams writes,

David Budescu (a cognitive psychologist who has studied the perception of uncertainty) has the following thoughts on John Sides's work on overestimation of immigrants:

I don't have much to add to some of the comments. This overestimation is, probably, due to a combination of several factors: (a) different definions of the target event (the judges may generalize and assume, for example, that all the children of foreign born residents are also born abroad), (b) vividness (members of of the target population stand out -- looks, accent, language, clothing), (c) clustering (often they are concentrated in certain areas), (d) typically, these surveys don't employ incentives for truthful responding (i.e. proper scoring rules), and some people may respond "strategically" by inflating their estimates to make a political point.

Overestimates of immigrants

In reference to the recent entry on misperception of minorities,
John Sides sent me the following data on the estimated, and actual, percentage of foreign-born residents in each of 20 European countries:

noimbro bar graph (443 x 587).jpg

The estimates are average survey responses in each country. People overestimate the % foreign born everywhere, but especially where the percentage is close to zero. This is consistent with the Erev, Wallsten, and Budescu findings about estimation of uncertain proportions.

John writes,

A question about multilevel modeling

Someone sent me a question about whether it makes sense to use multilevel modeling in a study of polls from many countries. I'll give the question and my response. The topic has been on my mind because I just wrote a discussion on this issue for the forthcoming issue of Political Analysis.

The question:

Estimate, no confidence interval

Phil Price pointed me to this:

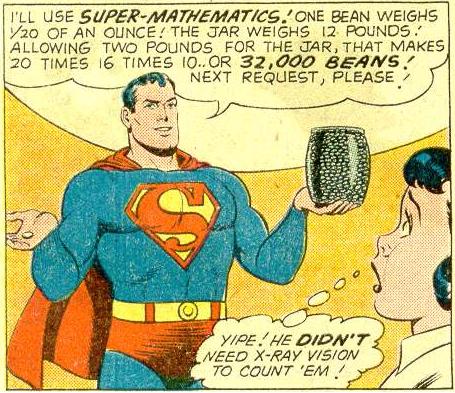
1007supermathematics1iw.jpg

The estimation procedure is OK (except for the calculation error, noted on the webpage) but I'd like to see an uncertainty interval.

Interactive graphics

Anthony Unwin writes,

The sample R code in Appendix C of GCSR (2nd edition) is pretty helpful, but I'm not happy with the graphics (surprise, surprise!). Your code for producing a collection of histograms means that they are all individually scaled. For comparative purposes they should, of course, be common scaled.

I'm looking forward to your reaction to my suggestion that you should incorporate interactive graphics in your course. One nice example of interaction that just occurs to me is to select a group of graphics with the mouse and then ask the system, perhaps via a pop-up dialog as in MANET, to common scale them.

I replied,

Columbia Causal Inference Meeting

On June 20, we had a miniconference on causal inference at the Columbia University Statistics Department. The conference consisted of six talks and lots of discussion. One topic of discussion was the use of propensity scores in causal inference, specifically, discarding data based on propensity scores. Discarding data (e.g., discarding all control units whose propensity scores are outside the range of the propensity scores in the treated group) can reduce or eliminate extrapolation, a potential cause of bias if the treated and control groups have different distributions of background covariates. However, it's sort of unappealing to throw out data, and can sometimes lead to treatment effect estimates for an ill-defined subset of the population. There was discussion on the extent to which modeling can be done using all available data without extrapolation. Other topics of discussion included bounds, intermediate outcomes, and treatment interactions. For more information, click here.

Tyler Cowen notes, from Harper's magazine, the following survey result: "Average percentage of the U.K. population that Britons believe to be immigrants: 21.
Actual percentage: 8."

A survey from 1995 in the U.S.

This reminded me of something I saw in the Washington Post about 10 years ago, that said that Americans, on average, overestimate the percentage of minorities in the country. I went to Nexis and looked it up (searched on "survey, black, hispanic", for the years 1991-1995 in the Post) and found it.

From the Post article, "Most whites, blacks, Hispanics and Asian Americans said the black population, which is about 12 percent, was twice that size." They similarly way overestimated the percentage of Hispanics and Asians in the country.

There were also systematic misperceptions about economic status. Once again, from the Post article, "A majority of white Americans have fundamental misconceptions about the economic circumstances of black Americans, according to a new national survey, with most saying that the average black is faring as well or better than the average white in such specific areas as jobs, education and health care. That's not true. Government statistics show that whites, on average, earn 60 percent more than blacks, are far more likely to have medical insurance and more than twice as likely to graduate from college."

Understanding the misperceptions

There's really a lot going on here and I'm not sure how to think about it all. These misperceptions seem important from a political perspective. How to understand where they come from? I wonder if basic cognitive biases can explain the misperceptions about the percentages of minorities. In particular, it is natural to bias your estimate of unknown probabilities toward 50/50 (Erev, Wallsten, and Budescu have written about this). Given that blacks, Hispanics, and Asians represent "natural kinds" or partitions of the population, it maybe should be no surprise that people overestimate their proportions. This would also explain the U.K. result.

This sort of reasoning is also consistent with the famous survey in which people grossly overestimate the proportion of the U.S. budget that goes to foreign aid. Small proportions will be overestimated.

The survey questions on economic views seem more complicated in that they would naturally be tied in with political ideology. It may be that a lot of whites don't want to answer Yes to the question, "Are blacks worse off than whites?" because they associate the question with specific policies, such as welfare benefits, that they don't like. Some of the quotes in the Post article (see below) seem relevant to this point. A Joe Bafumi showed in his Ph.D. thesis on the "stubborn American voter," it can be difficult to get accurate responses, even on a factual question, if people associate it with a political position.

As the saying goes, further research is needed here.

Jon Baron pointed me to this page which has the following funny story from Deb Frisch. (The story is also here.)

Teaching through role playing

I've always wanted to do role-playing demonstrations--activities in which different students play different roles in the context of a statistical problem--in my statistics classes, but I've rarely gotten them to work.

The only time it was effective was when I was teaching statistical consulting. I got two students to play the role of "consultants" and two students to be the "clients" (with a prepared folder of material from an actual consulting project in an earlier semester), and then when it was done, the other students commented on the performance of the "consultants." Anyway, I'd like to have role-playing demos for intro statistics classes.

I came across this set of games for teaching history, developed by Mark Carnes of Barnard College.

Deb Nolan had the following reaction:

I finally got a computer that could play the video (I have a new mac.) So I watched the role playing video at Barnard. A long time ago, two of my students did a role playing presentation of their data analysis project. They argued about whether HIV causes AIDS, one was Peter Duesberg. It was quite entertaining. I think it's a great idea. We could work a few of them in to our demos and projects.

But I'm still not quite sure how to implement it. Perhaps Tian has some ideas?

Diet soda and weight gain

I wonder what Seth Roberts thinks about this:

Study links diet soda to weight gain

BY DON FINLEY

San Antonio Express-News

A review of 26 years of patient data found that people who drink diet soft drinks were more likely to become overweight.

Not only that, but the more diet sodas they drank, the higher their risk of later becoming overweight or obese -- 65 percent more likely for each diet drink per day.

Bayesian infernece proceeds by taking the likelihoods from different data sources and then combining them with a prior distribution (or, more generally, a hierarchical model). The likelihood is key. For example, in a meta-analysis (such as the three examples in Chapter 5 of our book), you need the likelihood for each separate experiment. No funny stuff, no posterior distributions, just the likelihood. In a linear model setting, it's convenient to have unbiased estimates. I don't want everybody coming to me with their posterior distribution--i'd just have to divide away their prior distributions before getting to my own analysis.

Sort of like a trial, where the judge wants to hear what everybody saw--not their individual inferences, but their raw data. Anyway, it's kind of funny since we're always saying how Bayesian inference is the best, but really we don't want other people preprocessing their data in this way. When combining subjective estimates, the challenge is that there are no pure, unbiased data points.

See part 1 of this talk for more details.

I wrote awhile ago on the Flynn effect (the increase in population IQ from 1940 to 1990 in many countries) and Flynn's comments on the impossibility of meritocracy.

Several years ago, Seth Roberts, who told me about all this, had the idea of measuring changes in intelligence over time by looking at the complexity of newspapers and magazines. From a casual reading of Time magazine, etc., from 1950 or so, as compared to today, Seth had the impression that the articles had become more sophisticated.

ABout eight years ago, I set a couple of students to the task of scanning in some old magazine articles and looking at changes from 1950 to the present time. They then compared the articles using some simple readability formulas (letters per word, words per sentence, and a couple of other things--basically, whatever was already coded into Word). Nothing much came of it and we forgot the project.

Then recently I learned that Steven Johnson has written a book in which he found that TV shows have gotten more complex over the past few years, and directly connected it to the Flynn effect. I'm curious what Seth thinks about this--it seems to confirm his hypothesis.

In a series of blog entries, Carrie McLaren argues with Johnson (the commenters on the blog have lots of interesting things to say too). I don't have anything interesting to add here. I haven't read Johnson's book but it appears that he analyzed content rather than simply using things like readability formulas, which perhaps is why he found interesting results whereas we got stuck.

Physicists . . .

A colleague writes,

hi andrew,

here's a small question from a physicist friend:

can you point to a good reference on why regressing y/x against x is a bad thing to do...?

My short answer: it's not necessarily a bad thing to do at all. It depends on the context. In short: what are x and y?

My context-free comment is that if you're considering y/x, perhaps they are both positive, in which case it might make sense to work with log(x) and log(y), in which case the regression of log(y/x) on log(x) is the same as the regression of log(y) on log(x), with 1 subtracted from the slope (since log(y/x)=log(y)-log(x)).

P.S. I think it's ok for me to make fun of physicists since I majored in physics in college and switched to statistics because physics was too hard for me.

Time-series regression question

Iain Pardoe writes,

I was wondering if you might have any thoughts on the following ...

Suppose I have data collected over a period of years, with a response y and some predictors x. I want to predict y for the following year based on data collected up to that year. One approach is to model the data each year using ALL data collected up to that year. But what if you expect the relationship between y and x to change over time, i.e., you want to down-weight data from further in the past when fitting a model each year. You could ignore any data that is say more than 10 years old, but this seems a little ad-hoc. What might be a reasonable approach to doing this that isn't so ad-hoc?

Any thoughts?

What to read on survey sampling

I am sometimes contacted by people who want to conduct a survey, or who are planning to teach survey sampling, and want to know what to read. I recommend two books.

For the statistical theory and methods of sampling: Sampling: Design and Analysis, by Sharon Lohr (Arizona State University). This is a great book, combining the practical orientation of Kish (1965) with the clear notation of Cochran (1977). No other book I know of comes close to Lohr's. My only (minor) criticism of Lohr's book is that, when it comes to some areas on the research frontier (for example, poststratification with many categories), it is not always clear that there are open questions. I wouldn't mind seeing a few loose ends. I expect more of this will be in the forthcoming second edition.

For practical issues of conducting a survey: Survey Methodology, by Bob Groves, Floyd Fowler, Mick Couper, James Lepkowski, Eleanor Singer, and R. Tourangeau (Survey Research Center, University of Michigan). Lots of cool stuff, all in one place. These guys really know what they're doing.

A third book that's interesting is Analysis of Health Surveys, by Korn and Graubard. It has excellent material on analyzing survey data collected by others, a topic that does not get much emphasis in other books.

Baby Names

This is a really fun website.

You type in a name and it plots the popularity of the name since 1880. I of course first typed in my own name, and learned that it wasn't very common (110th most popular) when I was born, but was very common (4th most popular) in the 1990's. Which means that most of the Samanthas out there are much younger than I am. Does that mean people might expect me to be younger than I am because of my name? There are a lot of names that I associate with older people, but I can't think of too many that I associate with young people. Maybe that's just because I don't know many kids, though.

Objective and Subjective Bayes

Turns out I'm less of an objective Bayesian than I thought I was. I'm objective, and I'm Bayesian, but not really an Objective Bayesian. Last week I was at the OBayes 5 (O for objective) meeting in Branson, MO. It turns out that most of the Objective Bayes research is much more theoretical than I am. I like working with data, and I just can't deal with prior distributions that are three pages long, even if they do have certain properties of objectiveness.

Sample size and power calculations

Russ Lenth (Department of Statistics, University of Iowa) wrote a great article on sample size and power calculations in the American Statistican in 2001. I was looking for it as a reference for Barry's comment on this entry.

Anyway, I saw that Lenth has a webpage with a power/sample-size calculator and also some of the advice from his article, in easily-digestible form
. Perhaps this will be helpful to some of youall. I'm not happy with most of what's been written on sample size and power calculations in the statistical and biostatistical literature.

Also, here are some of my ramblings on power calculations.

I was spell-checking an article in WinEdt. It didn't like Ansolabehere and suggested "manslaughter" instead.

The difference between "statistically significant" and "not statistically significant" is not in itself necessarily statistically significant.

By this, I mean more than the obvious point about arbitrary divisions, that there is essentially no difference between something significant at the 0.049 level or the 0.051 level. I have a bigger point to make.

It is common in applied research--in the last couple of weeks, I have seen this mistake made in a talk by a leading political scientist and a paper by a psychologist--to compare two effects, from two different analyses, one of which is statistically significant and one which is not, and then to try to interpret/explain the difference. Without any recognition that the difference itself was not statistically significant.

Let me explain. Consider two experiments, one giving an estimated effect of 25 (with a standard error of 10) and the other with an estimate of 10 (with a standard error of 10). The first is highly statistically significant (with a p-value of 1.2%) and the second is clearly not statistically significant (with an estimate that is no bigger than its s.e.).

What about the difference? The difference is 15 (with a s.e. of sqrt(10^2+10^2)=14.1), which is clearly not statistically significant! (The z-score is only 1.1.)

This is a surprisingly common mistake. The two effects seem sooooo different, that it is hard for people to even think that their difference might be explained purely by chance.

For a horrible example of this mistake, see the paper, Blackman, C. F., Benane, S. G., Elliott, D. J., House, D. E., and Pollock, M. M. (1988). Influence of electromagnetic fields on the efflux of calcium ions from brain tissue in vitro: a three-model analysis consistent with the frequency response up to 510 Hz. Bioelectromagnetics 9, 215-227. (I encountered this example at a conference in radiation and health in 1989. I sent a letter to Blackman asking him for a copy of his data so we could improve the analysis, but he refused, saying the raw data were on logbooks and it would be too much effort to copy them. We'll be discussing the example further in our forthcoming book on applied regression and multilevel modeling.)

Jon Baron on intuitive judgment

I spoke last week at a workshop at Smith College on teaching statistics to undergraduate political science students. The organizers of the conference were Paul Gronke (Reed College) and Howard Gold (Smith College).


Here's my talk
. This talk was accompanied by several demonstrations and handouts, and this slideshow by itself has parts that may be hard to follow without that supplementary material.

It was lots of fun. The 20 or so people at the workshop enjoyed the demonstrations and there was lively discussion about teaching research methods to undergraduates in general and political science students in particular.

Normal curves

From Tian comes this picture from a Chinese news agency:

normalcurve.jpg

What's the deal? The picture looks a little fishy to me since the rightmost normal curve appears in front of the person whose body is in the foreground of the photo. But if things really looked like that, I would've loved to have been there to see it!

Victory!

We submitted a paper to a leading statistics journal, and one of the review reports included the following sentence:

Although the statistical methodology used is not particularly complex, sometimes a straightforward solution to a problem can be even more elegant than something that is technically more impressive.

At first I was a little miffed that they referred to our methods as "not particularly complex" but then I realized that this is really a victorious moment for applied Bayesian data analysis. Our paper used multilevel modeling, an adaptive Gibbs/Metropolis algorithm, posterior predictive checking, as well as tons of graphs and postprocessing of inferences.

Not too many years ago, we would have had to deal with generalized skepticism about Bayes, prior distributions, exchangeability, blah blah blah. Maybe even some objection to using a probability model at all. (One of my colleagues where I used to work once told me, "We don't believe in models.") And the reviewers who liked the paper would have gone on about how innovative it was. It's good to be able to skip over all that and go straight to the modeling (the "science," as Rubin would put it).

David Budescu writes,

We ran an experiment where subject made predictions about future value of many stocks based on their past performance. More precisely, they were asked to estimate 7 quantiles of the distribution of each stock:

Q05, Q15, Q25, Q50, Q75, Q85, and Q95

I would like to estimate the mean and SD (or variance) of this distribution based on these quantiles subject to weak assumptions (symmetry and unimodality) but without assuming a particular distribution.

I know of some methods (e.g. Pearson & Tukey, Biometrika, 1965) that use only 3 of these quantiles (Q05, Q50, and Q95) but I hate not to use all the data I have collected.

Does anyone know of a more general and flexible solution?

Any thoughts? Of course, some distribution would have to be assumed. Also, I wonder about assuming symmetry since the data would be there to reject the hypothesis of symmetry in some settings. Also, of course, I wonder whether the mean and sd are really what you want. Well, I can see the mean, since it's $, but I'm not so sure that the sd is what's wanted.

Last post on Popper (I hope)?

Jasjeet writes,

Hi Andrew,

I saw your recent exchange on falsification on your blog. I mostly agree with you, but I think the view of falsification presented is a little too simple---this is an issue with Popper's stance. I say this even though I'm very sympathetic to Popper's position. I suggest that you check out Quine's "Two Dogmas of Empiricism". Originally published in The Philosophical Review 60 (1951): 20-43. Reprinted in W.V.O. Quine, From a Logical Point of View (Harvard University Press, 1953). This is generally considered one of the canonical articles on the issue.

You may be interest to know that Kuhn tried to distance himself from the dominant reading of his work. The historian of science, Silvan Schweber, who knew Kuhn tells wonderfully funny stories about this at dinner parties. BTW, if you are interested in this stuff, you should check out Schweber's _QED and the Men Who Made It_. It is a great *history* of science book which also engages many philosophical issues. Philosophers of science generally bore me now. I say this as someone who spent many years reading this stuff. Philosophers of science became boring once there arose a sharp division between them and actual scientists. This was not true of earlier philosophers such as the logical positivists and people like Russell. But the second half of the 20th century was hard on philosophy...on this issue you should check out the work of your Columbia colleague Jacques Barzun ("From Dawn to Decadence" etc).

But if you do read some of of these people, I would really like to get your thoughts on what Richard Miller says about Bayesians in his "Fact and Method". Are they the modern logical positivists? Alas, I sometimes think so. One would think that the failure of Russell's Principia Mathematica, Godel and all of that would have killed logical positivism, but it hasn't.....

Cheers,
Jas.

The unicorn of probability theory

"A coin with probability p > 0 of turning up heads is tossed . . . " -- Woodroofe, Probability with Applications (1975, p. 108)

"Suppose a coin having probability 0.7 of coming up heads
is tossed . . . " -- Ross, Introduction to Probability Models (2000, p. 82)

The biased coin is the unicorn of probability theory—-everybody has heard of it, but it has never been spotted in the flesh. As with the unicorn, you probably have some idea of what the biased coin looks like—-perhaps it is slightly lumpy, with a highly nonuniform distribution of weight. In fact, the biased coin does not exist, at least as far as flipping goes.

Postdoc in Nottingham, England

Bill Browne, a statistician who does tons of work on multilevel model, especially for educational applications, has a 3-year postdoctoral position available in computational applied statistics. It looks interesting!

Chad on ethics

Chad Heilig is a statistics Ph.D. graduate of Berkeley who has moved from theoretical statistics to work at the CDC. He recently wrote a paper on ethics in statistics that will appear in Clinical Trials. The paper is interesting to read--it presents a historical overview of some ideas about ethics and statistics in medical studies.

Two key ethical dilemmas in clinical trials are:

(1) The conflict between the goal of saving future lives (by learning as much as possible, right away, about effectiveness of treatments), and the goal of treating current patients as effectively as possible (which, in some settings, means using the best available treatment, and in others means using something new--but will not, in general, correspond to random assignment).

(2) The conflict between the goals in (1)--to help current and future patients--and the goals of the researcher, which can include pure scientific knowledge as well as $, glory, etc.

As Chad points out, it's a challenge to quantify either of these tradeoffs. For example, how many lives will be saved by performing a large randomized trial on some drug, as compared to using it when deemed appropriate and then learning its effectiveness from observational studies. (It's well known that observational studies can give wrong answers in such settings.)

I completely disagree with the following statement on page 5 of the paper, which Chad attributes to Palmer (1993): "Where individual ethics is favored, one ought to employ Bayesian statistical methods; where collective ethics is favored, frequentist methods apply." This doesn't make sense to me. (For one thing, "frequentist methods" is an extremely general class which includes Bayesian methods as a special case.)

For a copy of the paper, email Chad at cqh9@cdc.gov

From George Box

I recently read George Box's paper "Sampling and Bayes' Inference in Scientific Modelling and Robustness" (JRSSA, 1980). It's a discussion paper, and I really liked his rejoinder. It starts like this:

"To clear up some misunderstandings and to set my reply in context, let me first make clear what I regard as the proper role of a statistician. This is not as the analyst of a single set of data, nor even as the designer and analyser of a single experiment, but rather as a colleague working with an investigator throughout the whole course of iterative deductive-inductive investigation. As a general rule he should, I think, not settle for less. In some examples the statistician is a member of a research team. In others the statistician and the investigator are the same person but it is still of value to separate his dual functions. Also I have tended to set the scene in the physical sciences where designed experiments are possible. I would however argue that the scientific process is the same for, say, an investigation in economics or sociology where the investigator is led along a pat, unpredictable a priori, but leading to (a) the study of a number of different sets of already existing data and/or (b) the devising of appropriate surveys.

Technically a Holiday

Check out the entry about name-changing on Chris Genovese's blog. It's fun and interesting.

Happy Memorial Day!

Sabermetricians vs. Gut-metricians

There's a little debate going on in baseball right now about whether decisions should be made using statistics (a sabermetrician is a person who studies baseball statistics) or instincts. Two books are widely considered illustrative of the two sides of the debate. Moneyball, by Michael Lewis, is about the Oakland A's and their general manager Billy Beane. Beane, with the second-lowest payroll in baseball in 2002, set out to put together an affordable team of undervalued players, using a lot of scouting and statistics. Three nights in August, by Buzz Bissinger, is about St. Louis Cardinals' manager Tony La Russa, and is seen by some as a counter to Moneyball, with La Russa relying much more on guts when making decisions.

Another one from the news

There's a really interesting article in Slate by Steven D. Levitt and Stephen J. Dubner (the authors of Freakonomics) about female births and heptatitis B. The disproportionate number of male births in some Asian countries has been attributed to causes such as selective abortion and infanticide. But, as explained in the paper "Hepatitis B and the Case of the Missing Women", by Harvard Economics graduate student Emily Oster, Hepatitis B infection rates actually explain a lot of the discrepancy. Pregnant women who have Hepatitis B are more likely to bear sons than daughters, and Hepatitis B is more common in those parts of the world where the proportion of male births is so high. Pretty cool.

Again, though, the reason I'm writing about the article doesn't have much to do with its subject matter. What struck me more than anything were the article's opening sentences:

The current most emailed headline on the New York Times website is titled "What Women Want," by op-ed columnist John Tierney. He's writing about a working paper, "Do Women Shy Away from Competition?", by Muriel Niederle and Lise Vesterlund, economists at Stanford University and the University of Pittsburgh, respectively. They conducted an experiment where men and women were first paid to add up numbers in their head, earning fifty cents for each correct answer (referred to as the "piece-rate" task). The participants were eventually offered the choice to compete in a tournament where the person who has the most correct answers after five minutes receives $2 per correct answer and everyone else receives zero compensation. One of the main points of the article was that, even at similar levels of confidence and ability, men were much more likely to enter the tournament than women, i.e., women are less willing than men to enter competition. The results of this study yield another possible theory for why there are so few women in top-paying jobs: Even in a world of equal abilities and no discrimination, family issues, social pressures, etc., women might be less likely to end up as tenured professors or CEOs because the jobs are so inherently competitive.

Thoughts on Teaching Regression

I recently finished my first semester of teaching. I was a TA in grad school, but this was my first time being "the professor." I was teaching a regression course, and there are several things I'd like to do differently should I teach the same class again in the future. I just have to figure out how.

Zhiqiang Tan (Biostatistics, Johns Hopkins) writes, regarding my blog entry on regression and matching.

I wrote:


I'm imagining a unification of matching and regression methods, following the Cochran and Rubin approach: (1) matching, (2) keeping the treated and control units but discarding the information on who was matched with whom, (3) regression including treatment interactions. I'm still confused about exactly how the propensity score fits in.

Zhiqiang writes:

In fact, I'm also working on "causal inference". As I understand, there is a fundamental gap between the idea of propensity score and the likelihood principle or Bayesian inference. The likelihood is factorized in terms of the outcome regression and the propensity score, so that any (parametric) likelihood or Bayesian inference would necessarily ignore the propensity score! One way to reconcile the two "ideas" is to look at the joint distribution of covariates and outcome, as in my paper "Efficient and Robust Causal Inference: A Distributional Approach".

As you can see, the idea is connected to the likelihood formulation for Monte Carlo integration. Here I worked on propensity score weighting as opposed to matching, and followed maximum likelihood/frequentist instead of Bayesian.

My response: I agree that propensity score methods don't tie directly to likelihood or Bayesian inference. I think the appropriate link is through poststratification. But actually carrying out this modeling in a reasonable way is a challenge--an important research problem, I think.

My quick and lazy comments on Zhiqiang's paper: The tables should be graphs. Figure 1 could use a caption explaining what models 1-4 are, and what the two graphs are. The graphs in Figures 2 and 3 can be made smaller, and they should be rotated 90 degrees.

OK, now I have to read the paper for real.

With all this discussion of Kuhn and scientific revolutions, I've been thinking of the applicability of these ideas to my own research experiences.

At the risk of being trendy, I would characterize scientific progress as self-similar (that is, fractal). Each level of abstraction, from local problem solving to big-picture science, features progress of the "normal science" type, punctuated by occasional revolutions. The revolutions themselves have a fractal time scale, with small revolutions occurring fairly frequently (every few minutes for an exam-type problem, up to every few years or decades for a major scientific consensus).

For example . . .

At the largest level, human inquiry has perhaps moved from a magical to a scientific paradigm. Within science, the dominant paradigm has moved from Newtonian billiard balls, to Einsteinan physics, to biology and neuroscience and, I dunno, nanotechnology? Within, say, psychology, the paradigm has moved from behaviorism to cognitive psychology. In the comment on my earlier blog entry, Dan Navarro gave an example of a paradigm shift within cognitive psychology.

But even on smaller scales, I see paradigm shifts. For example, in working on an applied research or consulting problem, I typically will start in a certain direction, then suddenly realize I was thinking about it wrong, then move forward, etc etc. In a consulting setting, this reevaluation can happen several times in a couple of hours. At a slightly longer time scale, I'll commonly reassess my approach to an applied problem after a few months, realizing there was some key feature I was misunderstanding.

So, anyway, I see this normal-science and revolution pattern as fundamental. Which, I think, ties nicely into my Bayesian perspective of deductive Bayesian inference as normal science and model checking as potentially revolutionary.

(I guess that wasn't so trendy--fractals are so '80s, right?)

Summary

Scientific progress is fractal in size of problem and in time scale. (As always, any references to related work in the history or philosophy of science would be appreciated.)

Aleks pointed me to this paper by James Felton, John Mitchell, and Michael Stinson (Central Michigan University that finds that students' ratings of professors' teaching quality are highly correlated with their ratings of the "easiness" of the course and the "sexiness" of the professors. (I'd point out that all the tables could (and should) be replaced by graphs, but you know that by know, right?)

This paper reminded me of the work of Daniel Hamermesh (University of Texas), who has written several papers on the rewards of beauty, including one on beauty and teaching evaluations. A couple of years ago, I saw some news blurb on this last paper and I emailed Hamermesh (who I've never met) and asked him for the data for the students in my multilevel modeling class to play with. He very graciously sent me the data, and my students always enjoy analyzing them.

We've been eating candy with lead

Carrie points to an article in the Orange County Register reporting that lots of Mexican candy has lead in it. One of the candies in Carrie's graphic looked familiar, so I clicked on the link and saw that I've eaten a lot of these candies! I actually have some in a jar in my office and have been giving them out to students!

The Register article focuses on Mexico, but I've seen these candies in sale in Guatemala also. According to the article, the chili powder in the candies and the ink in the wrappers is contaminated with lead. Pretty scary, especially considering that my in-laws used to eat these as kids, and we still get them occasionally as treats.

I'm all confused!

Are our experiments too large or are they too small?

Multilevel modeling questions

Karyn Heavner (Office of Program Evaluation and Research, AIDS Institute, New York State Department of Health) wrote to ask:

The "20 questions" machine

Alex Tabarrok discusses a machine (well, a computer program embedded in a toy) that plays 20 questions. 20 questions is one of my favorite games, so I thought I'd try it out--here's the link. It's a nicely designed site and was easy and fun to play.

I was disappointed that it didn't guess either of my items--but then again I'm an experienced 20 questions player. As in charades (my all-time favorite game), the key is to not simply think of the first thing that comes into your head, since that's the first thing people will guess. An obvious principle, but people usually don't go to the trouble. So I guess I'm not surprised that it can usually guess people's items.

I also realized that the q.20q.net people play by different rules than I do. In the rules as I always understood them, the thing to be guessed had to be a famous item. Thus, "a coat" or "a wool coat" would not work, but "the coat that Sir Walter Raleigh laid down for Queen Elizabeth" would be OK. Also, "Aunt Lucy" is no good, but "Luther Burbank" would be OK. But not "Luther Burbank's foot", since that's not famous in itself. Anyway, this game expects items along the lines of "a stick" (that was its guess of one of my items).

But, hey, it's just a computer program, so I shouldn't be too hard on it!

Hangman also

The site also has a Hangman game, but I was disappointed to see that it only would allow me to guess its words. I wanted to see if it could guess some of my stumpers.

I bet a computer could be really good at Jotto, though.

Death by survey

Emmanuela Gakidou and Gary King (Institue for Quantitative Social Science, Harvard) wrote a cool paper, "Death by survey: estimating adult mortality without selection bias," in which they consider estimates of mortality based on "survey responses about the survival of siblings, parents, spouses, and others." By explicitly modeling the missing-data process, they correct for selection biases such as, dead persons with more siblings are more likely be counted in a survey asking about the deaths of siblings. (And persons with no siblings won't be counted at all.)

In the 1990s, three popular topics of conversation went along the lines of,

"Michael Jordan is the greatest basketball player ever,"

"Tiger Woods is the greatest golfer ever," and

"Bill Gates is the richest guy ever."

I recall a sort of collective happiness that would occur when Jordan acheived another "three-peat," or when Woods won another tournament, or when people would calculate how much money Gates was making every second. It was like we were all rooting for them to win and set new records. Just a thrill that they would put themselves in "can you top this?" settings and continue to succeed.

Of course this was not new (various other "mostest ever" pop phenomena in recent decades include Secretariat, the Beatles, Michael Jackson, and Steven Spielberg) but the 90s seem to my memory to have had more of it.

How to think of all this? Is there something to what I'm saying and, if so, is it important? Is there some way to measure it?

There was a lot of fascinating discussion on this entry from a few days ago. I feel privileged to be able to get feedback from scientists with different perspectives than my own. Anyway, I'd like to comment on some things that Dan Navarro wrote in this discussion. Not to pick on Dan but because I think his comments, and my responses, may highlight some different views about what is meant by "Bayesian inference" (or, as I would prefer to say, "Bayesian data analysis," to include model building and model checking as well as inference).

So here goes . . .

I noticed the blog of Kevin Brancato. I've been enjoying reading the blog entries, especially since Kevin is a former student of ours at Columbia! His paper on macroeconomic statistics is also interesting (and relevant to some of my work).

Kevin worked as a research assistant for me a few years ago on a project which eventually appeared in the Journal of Business and Economic Statistics under the title, "Regression Modeling and Meta-Analysis for Decision Making: A Cost-Benefit Analysis of Incentives in Telephone Surveys."

Here's the abstract of the paper:

Here are the slides of the talk I gave at the CDC last week. And here's the abstract:

Multilevel (hierarchical) models are increasingly popular for data with hierarchical, longitudinal, and cross-classified structures. We consider several questions that arise in the application of multilevel models, including (in no particular order): How many groups do you need to fit a multilevel model? When to use fixed or random effects? Can multilevel models be used for nonnested data? Is it true that Anova is just a special case of linear regression? Is there such a thing as R-squared for multilevel models? Can predictive error be used to compare models? How to handle correlations between individual-level predictors and group-level errors? How to model varying slopes and intercepts? How can I get my model to converge faster on the computer? How to summarize and display the estimates from a model with a zillion coefficients? How to check the fit of a multilevel model? How to choose among the thousands of possible interactions? What to do when a realistic model is so complex that I can't understand it???

After the 2004 election I had this idea that Bush's victory over Kerry is analogous to Truman's over Dewey in 1948. In both cases, the incumbent had attained office indirectly (through Roosevelt's death for Truman, and with a popular vote minority for Bush), had not-so-great approval ratings during the campaign, and was expected to lose to a challenger who looked strong on paper. But again, in both cases, the incumbent ran a combative campaign appealing to his base and surprised many with a strong victory for himself and his party. But then after all was over, the incumbent's popularity remained fairly low.

I don't really know what to make of this reasoning. My perceptions of Truman and Bush are both mostly from written sources. Obviously the two men have a lot of differences, but I do remember that G. W. Bush was perceived as some sort of centrist in the 1990s and now seems more of a strong conservative, and similarly Truman seemed to have moved, at least in perception, from a centrism to strong liberalism.

A key issue in the analogy, I suppose, is the implicit suggestion that Bush in 2005-2008, like Truman in 1949-1952, could see a continuing decline in approval followed by a loss in his party's control of Congress. Or, to put a different spin on it, that in retrospect Truman is generally viewed positively, in that some of his domestic and foreign policies that were unpopular at the time but are now respected as principled.

I don't really know how to think about this sort of analogy. I guess the key connection is the election win without a strong approval rating. That Bush and Truman both have the image of fighting partisans (e.g., the famous poll that said that half the people thought that Bush was a "uniter not a divider" and half didn't) also seems relevant to me. Perhaps this idea could be studied statistically by looking at the relation between Presidents' approval ratings and their abilities to achieve policy goals. After controlling for party control of the houses of Congress, how predictive is Presidential approval of Presidential policy successes? I imagine someone has studied this.

Some barely related comments on statistical graphics

P.S. Here's a paper by Charles Franklin on graphing Presidential approval (or other time series, for that matter). I like the paper--its Figure 5 has a particularly clear plot of all the approval series on a common scale. (Clinton and Roosevelt are the only Presidents with generally upward trends in approval--I didn't know that.)

Franklin's Figure 5 has a lot of little features that make it more useful and readable:

- Most important, the plot for each of the 12 presidents (from Roosevelt to G. W. Bush) is small (but clear), so there is room for all 12 to fit together on a small page.
- There are light guidelines at 1 year, 2 years, 3 years, and 4 years, so the reader can easily see when different things are happening.
- The approval series themselves are shown by thin lines so that the time spacing of the data is clear. I can't tell you how many graphs I've seen that were marred by lines that were too fat.
- The y-axis goes from 0 to 100. This makes sense since these are the theoretically highest and lowest approval ratings. Little would be gained by restricting to the range of the data (approximately 20% to 95%). This is obvious, but graphics programs will restrict by default, so Franklin gets credit for keeping the full scale in for clarity in interpretation.

I also have some minor criticisms of the graphical presentation:

- The 12 presidents are listed in a 3x4 grid, with Roosevelt at the bottom left and Bush at the upper right. Given how we usually read, I'd prefer to start with Roosevelt on the upper left and then go across and down from there.
- The time scale is presented in months. Years would be better. It's not so important since the guidelines at each year are given, but still, labels at 0,2,4,6,8 would be best.
- The presidents are listed by two-to-four-letter abbreviations. Some are clear (FDR, JFK), some required puzzling out (HST, GRF, JEC). But why bother abbreviating? There's enough space in the label area of each plot to write "Roosevelt", "Truman", etc.

Bayes, Popper, and Kuhn

Since I'm referring to other people's stuff, let me link to a recent entry on statistics and philosophy in Dan Navarro's blog. Which I pretty much agree with except for the remark that Bayesian statistics is Kuhnian. I disagree strongly--I think Bayesian data analysis is Popperian. But, then again, Sander Greenland disagrees with me. So who knows?

I've always been turned off by Kuhn's philosophy of science and preferred Popper's more hard-line falsificationist attitude. And I see Bayesian data analysis as fitting well into the falsificationist approach--as long as we recognize that BDA includes model checking (as in Chapter 6 of our book) as well as Bayesian inference (which, as far as I can tell, is purely deductive--proceeding from assumptions to conclusions). Yes, we "learn," in a short-term sense, from Bayesian inference--updating the prior to get the posterior--but this is more along the lines of what a Kuhnian might call "normal science." The real learning comes in the model-checking stage, when we can reject a model and move forward. The inference is a necessary stage in this process, however, as it creates the strong conclusions that are falsifiable.

Bayes and parsimony

Check out Peter Grunwald's long comment on this entry on Bayes and parsimony. He has some interesting things to say, most notably in cautioning that Bayesian inference will not necessarily get you to the true model, or even close to the true model, even with large sample sizes. I don't have much to add to his thoughts, except to note that he seems to be working with discrete models, and I usually work with continuous models. I know that the distinction between discrete and continuous is somewhat arbitrary (for example, I use logistic regression for binary data, thus using a continuous model for discrete data). Nonetheless, I suspect that some of his coding ideas are particularly appropriate for discrete models, and some of my hierarchical modeling ideas make the most sense for continuous models. In particular, when fitting a continuous model, I see no advantage (beyond the very real issues of cost, computation, and storage) to zeroing out a variable rather than just shrinking it. But in a discrete model, I can imagine that such "quantum" phenomena occur in fitting. I'm curious what Radford thinks.

(I like Peter Grunwald, without meeting him, because according to his webpage he has a daughter named Wiske, which reminds me of Suske and Wiske, names which I like the sound of.)

Are nicer and better-informed citizens more likely to vote?

James Fowler (political science, UC Davis) wrote an interesting paper about a lab experiment he conducted, demonstrating the connection between other-regarding preferences and voter turnout. Here's the abstract:

Scholars have recently reworked the traditional calculus of voting model by adding a term for benefits to others. Although the probability that a single vote affects the outcome of an election is quite small, the number of people who enjoy the benefit when the preferred alternative wins is large. As a result, people who care about benefits to others and who think one of the alternatives makes others better off are more likely to vote. I test the altruism theory of voting in the laboratory by using allocations in a dictator game to reveal the degree to which each subject is concerned about the well-being of others. The main findings suggest that variation in concern for the well-being of others in conjunction with strength of party identification is a significant factor in individual turnout decisions. Partisan altruists are much more likely to vote than their nonpartisan or egoist peers.

I especially like this paper because it is consistent with the model of Edlin, Kaplan, and myself of the rationality of voting based on social motivations. As we (and Fowler) point out, there's no reason that "rationality" has to mean "selfishness."

Many researchers in political science and economics seem to feel that it is "cheating" to introduce other-directed preferences into a rational choice model, but given both the logic and the evidence (Fowler's paper gives some experimental evidence, and our paper has lots of observational evidence), I don't see that selfishness makes much sense in this setting.

Some other comments

The other day in our research group we discussed a recent paper by Delia Grigg and Jonathan Katz (Social Sciences, Caltech) on majority-minority districts and Congressional elections. Jeronimo presented the paper, and David Epstein and I discussed it. This was a lively discussion, partly because Jonathan's conclusions disagreed with the findings of David's work on majority-minority redistricting (for example, this paper with Cameron and O'Halloran). In fact, scanning David's online C.V., he appears to have a paper with Sharyn O'Halloran from 2000 entitled, "The Impact of Majority-Minority Districts on Congressional Elections," which is the exact same title as Grigg and Katz's paper!

The Grigg and Katz paper had two main conclusions: first, that majority-minority districts (MMDs) increase minority representation, and second, that there is no evidence that MMDs help the Republicans. According to David, the first claim is in agreement with what all others have found, so we focused on the second claim, which would seem to contradict David's earlier study that found MMDs helping the Republicans.

This is (or has been) a big deal in redistricting in the U.S.: is it appropriate to carve out districts with mostly minority population, in order to increase the representation of ethnic minorities in the legislature? Will such rediscticting, paradoxically, help the Republicans (a party supported by only a small proportion of ethnic minority voters in the U.S.)?

I don't have any recent data easily at hand, but here's some representation data from 1989 (reproduced in this 2002 paper in Chance):

Proportion of
Proportion of seats in House
U.S. population of Representatives
Catholic 28% 27%
Methodist 4% 14%
Jewish 2% 7%
Black 12% 9%
Female 51% 6%
Under 25 37% 0

Major comments

On to Grigg and Katz . . . their paper has some data on individual districts but focuses on analyses with state-years as units, comparing states with no minority-majority districts to states that have at least one majority-minority district. Our main comment was that these comparisons will be difficult, for two reasons:

1. States with majority-minority districts are much different than states without. For one thing, states without MMD's are much smaller (this can be seen in Figure 3 of Griggs and Katz; the discreteness of the "no MMD" proportions imply that these are states with few congressional districts.

If we are imagining MMD's to be a "treatment" and are interested in the effect of MMD's, then we want to compare comparable states that do and don't have MMD's. Keeping all 50 states in the analysis might not make sense, since many states just don't have a chance of getting MMD's.

2. We were wondering if it would be helpful to look at the number of MMD's in a state. We could imagine that a state would necessarily have 1 or 2 MMD's, just from geography, but then redistricters could have the option to increase that to 3 or 4. In this case, we'd want to compare numbers, not just 0 vs. 1-or-more.

Other comments

Grigg and Katz used a parametric-form seats-votes curve (from King and Browning, 1987) to estimate partisan bias and electoral responsiveness in groups of state elections. I suspect they'd get much more precise and informative results using the newer JudgeIt approach (see here for a description and derivation).

To confirm things, I'd suggest that Griggs and Katz fit their models, using as outcome the Republican share of seats in the state. This is cruder than partisan bias but might show some general patterns, and it's less subject to criticisms of their parametric seats-votes model.

I liked how they presented their data and results using graphs. But we had a couple of questions. First, what are those "no MMD" points on the far right of Figure 14? We were wondering which was the state that was 35% minority, with minority Congressional seat shares around 40%, but no majority-minority districts. We were also confused about the tables on page 27 because we couldn't get the numbers to add up.

In summary . . .

The Grigg and Katz paper is an innovative look at majority-minority districting, following an approach of looking at the whole state rather than one district at a time. This is an approach Gary King and I have liked in studying redistricting in other contexts. However, I am not sure what to make of Grigg and Katz's substantive conclusions, because I don't know that their comparisons of states are appropriate for this observational study, and I worry about their measure of partisan bias. I hope these comments are helpful in their revision of this paper, and I thank Jonathan for sharing the paper with us.

P.S. Some people find political redistricting, or race-based redistricting, distasteful. By evaluating these programs, we are not making any moral judgment one way or another. Rather, we're trying to answer some empirical questions that could be relevant for considering such plans in the political process.

A question on graphics

Boris writes,

Fully Bayesian analyses of hierarchical linear models have been considered for at least forty years. A persistent challenge has been choosing a prior distribution for the hierarchical variance parameters. Proposed models include uniform distributions (on various scales), inverse-gamma distributions, and other families. We have recently made some progress in this area (see this paper, to appear in the online journal Bayesian Analysis).

Problems

The inverse-gamma has been popular recently (partly because it was used in the examples in the manual for the Bugs software package) but it has some unattractive properties--most notably, in the limit that the hyperparameters approach zero, the posterior distribution does not approach any reasonable limit. This casts suspicion on the standard use of prior densities such as inverse-gamma(0.001,0.001).

Progress!

We have a new folded-noncentral-t family of prior distributions that are conditionally conjugate for the hierarchical normal model. The trick is to use a redundant multiplicative parameterization for the hierarchical standard deviation parameter--writing it as a product of two random variables, one with normal prior distribution and the other with an square-root-inverse-gamma model. The product is a folded-noncentral-t.

A special case of this model is the half-Cauchy (that is, the positive part of a Cauchy distribution, centered at 0). We tried it out on a standard example--the 8-schools problem from Chapter 5 of Bayesian Data Analysis--and it works well, even for the more challenging 3-schools problem, where usual noninformative prior distributions don't work so well.

Hierarchy of hierarchies

The half-Cauchy and its related distributions need some hyperparameters to be specified. The next step is to estimate these from data, by setting up a hyper-hyper-prior distribution on the multiple variance parameters that will exist in any hierarchical model. Actually, it's sort of cool--I think it's the next logical step to take in Bayesian Anova. We have an example in Section 6 of see this paper.

What comes next?

The next step is to come up with reasonable models for deep interactions (see here for some of our flailing in this area). Currently, the most challenging problems in multilevel models arise with sparse data with many possible levels of variance--and these are the settings where hierarchical hyper-hyper modeling of variance parameters should be possible. I think we're on the right track, at least for the sorts of social-science problems we work on.

The other challenge is multivariate hierarchical modeling, for example that arise in varying-intercept, varying-slope models. Here I think the so-called Sam method has promise, but we're still thinking about this.

A fix to the mvrnorm function

Recently when our Bayesian Data Analysis class was doing Gibbs sampling in R, some students noticed that they get missing values when sampling from multivariate normal distribution using the function mvrnorm in R (in the package MASS). The function seems to fail in some cases. This is due to some weirdness in the basic R function eigen that computes eigenvalues, so mvrnorm itself is not to blame. However mvrnorm might be the function you use more often so I wrote a simple patched version of mvrnorm which should fix this problem. It will also alert the user if the patch fails.

Details and more are here.

Does anybody do MCMC Sampling in R?

Have you done any MCMC sampling in R? Or, what programs to you use to do iterative sampling? How do you summarize the results? Just trust BUGS do everything?

Sometimes writing your own sampler may be inevitable. In our research there have been cases when BUGS just gets stuck. I'm writing an R program that should make writing samplers a semi-automatic task. Also I'm finishing the beta version of a random variable object class in R. Manipulating such objects instead of raw simulations should make Bayesian programming much more intuitive.

If you have any comments about your experiences about writing your own samplers and summarizing simulations, please leave a comment! Your comments will be helpful in developing the programs.

Carrie noticed an article in the Carlat Report describing some methods used in sponsored research to induce bias in drug trials:

1. Make sure your drug has a dosage advantage. This way, you can present your findings as a “head-to-head” trial without worrying that your drug will be outperformed. Thus, a recent article on Cymbalta concluded that “in three comparisons, the mean improvement for duloxetine was significantly greater than paroxetine or fluoxetine.” (Depression and Anxiety 2003, 18; 53-61). Not a surprising outcome, considering that Cymbalta was ramped up to a robust 120 mg QD, while both Prozac and Paxil were kept at a meek 20 mg QD.

2. Dose their drug to cause side effects. . . . The original Lexapro marketing relied heavily on a study comparing Lexapro 10 mg and 20 mg QD with Celexa 40 mg QD—yes, patients in the Celexa arm were started on 40 mg QD (J Clin Psychiatry 2002; 63:331-336). The inevitably higher rate of discontinuation with high-dose Celexa armed Forest reps with the spin that Lexapro is the best tolerated of the SSRIs. . . .

3. Pick and choose your outcomes. If the results of the study don’t quite match your high hopes for the drug, start digging around in the data, and chances are you’ll find something to make you smile! Neurontin (gabapentin) is a case in point. . . .

4. Practice "creative writing" in the abstract.

Carlat also cites a study from the British Medical Journal finding that "Studies sponsored by pharmaceutical firms were four times more likely to show results favoring the drug being tested than studies funded by other sources."

I don't know enough about medical trials to have a sense of how big a problem this is (or, for that matter, how to compare the negatives of biased research to the positives associated with research sponsorship), but at the very least it would seem to be a great example for that "how to lie with statistics" lecture in an intro statistics class.

One thing that interests me about Carlat's methods is that only item 3 ("Pick and choose your outcome") and possibly item 4 ("Practice creative writing") fit into the usual "how to lie with statistics" framework. Items 1 and 2, which involve rigging the design, are new to me. So maybe this would be a good article for an experimental design class.

For more examples and discussion, see the article by Daniel Safer in Journal of Nervous and Mental Disease 190, 583-592 (2002), cited by Carlet.

Too busy

Here's another Applied Micro talk I won't be able to see. But it looks interesting . . .

We had an interesting discussion on the blog entry last week about Bayesian statistics, where we wrote,

Boris presented the TSCS paper at midwest and was being accused by Neal Beck for not being a real Bayesian. Beck was making the claim that "we're not Bayesians" because we're using uninformative priors. He's seems to be under the assumption that bayesians only use informative priors.

Neal reports that he had more to say and graciously emailed me a longer verision of his comment about Bayesian methods. Neal has some interesting things to say. I'll present his comments, then my reactions.

  1 2 3 4 5 6 7 8 9 10 11 12 13 14 15 16 17 18 19 20 21 22 23 24 25 26 27 28 29 30 31 32 33 34 35 36 37 38 39 40 41 42 43 44 45 46 47 48