Results matching “R”

A new course on statistical graphics

I'm planning to teach a new course on statistical graphics next spring.

Background:

Graphical methods play several key roles in statistics:

- "Exploratory data analysis": finding patterns in raw data. This can be a challenge, especially with complex data sets.
- Understanding and making sense of a set of statistical analyses (that is, finding patterns in "cooked data")
- Clear presentation of results to others (and oneself!)

Compared to other areas of statistics, graphical methods require new ways of thinking and also new tools.

The borders of "statistical graphics" are not precisely defined. Neighboring fields include statistical computing, statistical communication, and multivariate analysis. Neighboring fields outside statistics include computer programming and graphics, visual perception, data mining, and graphical presentation.

Structure of the course:

Class meetings will include demonstrations, discussions of readings, and lectures. Depending on their individual interests, different students will have to master different in-depth topics. All students will learn to make clear and informative graphs for data exploration, substantive research, and presentation to self and others.

Students will work in pairs on final projects. A final project can be a new graphical analysis of a research topic of interest, an innovative graphical presentation of important data or data summaries, an experiment investigating the effectiveness of some graphical method, or a computer program implementing a useful graphical method. Each final project should take the form of a publishable article.

The primary textbook will be R Graphics, by Paul Murrell (to be published Summer, 2005).

See below for more information on the course; also see here for a related course by Bill Cleveland (inventor of lowess, among other things). Any further suggestions would be appreciated.
Against parsimony, again

The comments to a recent entry on "what is a Bayesian" moved toward a discussion of parsimony in modeling (also noted here). I'd like to comment on something that Dan Navarro wrote. First I'll repeat Dan's comments, then give my reactions.

Loss aversion etc

If a person is indifferent between [x+$10] and [55% chance of x+$20, 45% chance of x], for any x, then this attitude cannot reasonably be explained by expected utility maximization. The required utility function for money would curve so sharply as to be nonsensical (for example, U($2000)-U($1000) would have to be less than U($1000)-U($950)). This result is shown in a specific case as a classroom demonstration in Section 5 of a paper of mine in the American Statistician in 1998 and, more generally, as a mathematical theorem in a paper by my old economics classmate Matthew Rabin in Econometrica in 2000.

I was thinking about this stuff recently because of a discussion I had with Deb Frisch on her blog. I like Matt's 2000 paper a lot, but Deb seems to be really irritated by it. Her main source of irritation seems to be that Matt writes, "The theorem is entirely 'nonparametric,' assuming nothing about the utility function except concavity." But actually he assumes fairly strong assumptions about preferences (basically, a more general version of my [x, x+$10, x+$20] gamble above), and under expected utility, this has strong implications about the utility function.

Matt's key assumption could be called "translation invariance"--the point is that the small-stakes risk aversion holds at a wide range of wealth levels. That's the key assumption--the exact functional form isn't the issue. Deb compares to a power-law utility function, but expected-utility preferences under this power law would not show substantial small-scale risk aversion across a wide range of initial wealth levels.

Deb did notice one mistake in Matt's paper (and in mine too). Matt attributes the risk-averse attitude at small scales to "loss aversion." As Deb points out, this can't be the explanation, since if the attitude is set up as "being indifferent between [x+$10] and [55% chance of x+$20, 45% chance of x]", then no losses are involved. I attributed the attitude to "uncertainty aversion," which has the virtue of being logically possible in this example, but which, thinking about it now, I don't really believe.

Right now, I'm inclined to attribute small-stakes risk aversion to some sort of rule-following. For example, it makes sense to be risk averse for large stakes, and a natural generalization is to continue that risk aversion for payoffs in the $10, $20, $30 range. Basically, a "heuristic" or a simple rule giving us the ability to answer this sort of preference question.

Attitudes, not preference or actions

By the way, I've used the term "attitude" above, rather than "preference." I think "preference" is too much of a loaded word. For example, suppose I ask someone, "Do you prefer $20 or [55% chance of $30, 45% chance of $10]?" If he or she says, "I prefer the $20," I don't actually consider this any sort of underlying preference. It's a response to a question. Even if it's set up as a real choice, where they really get to pick, it's just a preference in a particular setting. But for most of these studies, we're really talking about attitudes.

Continuing the discussion of Neal Beck's comment on David Park's models: the concept of Bayesian inference has been steadily generalized over the decades. Let me steal some words from my 2003 article in the International Statistical Review:

It is an important tradition in Bayesian statistics to formalize potentially vague ideas, starting with the axiomatic treatment of prior information and decision making from the 1920s through the 1950s. For a more recent example, consider hierarchical modeling.

Intermittent phone service

I had always thought of "households with phones" and "households without phones" as two disjoint populations, with only the first group reachable by a telephone survey. In fact, I used this as an example in teaching surveys to distinguish between the "population" of phone households and the "universe" of all households. But when doing the weighting for the NYC Social Indicators Survey, we learned that about as many people in the U.S. have intermittent phone service as have no phone service--and if people with intermittent service have a phone about half the time, then they are indeed represented (although underrepresented) in phone surveys.

Are we not Bayesians?

David reports,

Boris presented the TSCS paper at midwest and was being accused by Neal Beck for not being a real Bayesian. Beck was making the claim that "we're not Bayesians" because we're using uninformative priors. He's seems to be under the assumption that bayesians only use informative priors. Boris should have just directed him to your book and told him to read chapters 1 and 2! I know you've spoken to Beck before, but have you ever had such an exchange with him on this topic? He kept making the claim that if you use diffuse priors, all you're doing is MLE. It may be true that for many simple anaylses that bayesian inference and MLE can produce similar results, but Bayesian inference can easily be extended to more complex problems (something that MLE may have a harder time doing).

What is Bayesian inference?

My reply: Bayesian inference is characterized by the use of the posterior distribution--the distribution of unknowns, conditional on knowns. Bayesian inference can be done with different sorts of models. In general, more complex models are better (see here, also with some interesting discussion), but a simpler model is less effort to set up and can be used as a starting point in a wide range of examples.

Diffuse prior distributions

Diffuse prior distributions are a type of simplification. Other simplifications we commonly use are conventional data models such as the normal distribution, and conventional transformations such as logit or probit. Bayesian inference with these models is still Bayesian. In the model-checking stage of Bayesian data analysis (see Chapter 6 of our book), you can check the fit of the model and think about how to improve it.

More technically, an improper prior distribution can be considered as "noninformative" if it is a stable limit of proper prior distributions (see Sections 2.2-2.4 of this paper).

Hmmm . . . let me try to put this more aphoristically. Bayesian inference with the right model is better than Bayesian inference with a wrong model. "Improper" models (that is, models without a joint probability distribution for all knowns and unknowns in the model) cannot be right. But Bayesian inference with a wrong model is still Bayesian.

Update (19 Apr 05): Neal says he was misquoted. He also says he'll reply soon.

We would like to incorporate matching methods into a Bayesian regression framework for causal inference, with the ultimate goal of being able to do more effective inference using hierarchical modeling. The founding work here are papers by Cochran and Rubin in 1973, demonstrating that matching followed by regression outperforms either method alone, and papers by Rosenbaum and Rubin in 1984 on propensity scores.

Right now, our starting points are two recent review articles, one by Guido Imbens on the theory of regression and matching adjustments, and one by Liz Stuart on practical implementations of matching. So far, I've read Guido's article and have a bunch of comments/questions. Much of this involves my own work (since that's what I'm most familiar with), so I apologize in advance for that.

There was a lively discussion of my entry with googlefights between Clinton and Bush, so I thought it might be worth saying how this could be used for a project in an intro stats class.

Higher-income states support the Democrats, but higher-income voters support the Republicans. This confuses a lot of people (for example, see here and here).

Boris presented our paper on the topic at the Midwest Political Science meeting last weekend. Here's the presentation (we're still working on the paper).

Here's the abstract for the paper:

Seth on small-n and large-n studies

After reading Seth Roberts's article on self-experimentation, I had a dialogue with him about when to move from individual experimentation to a full-scale controlled experiment with a large-enough n to obtain statistically significant results. My last comment said:

But back to the details of your studies. What about the weight-loss treatment? That seems pretty straightforward--drink X amount of sugar water once a day, separated by at least an hour from any meals. To do a formal study, you'd have to think a bit about what would be a good control treatment (and then there are some statistical-power issues, for example in deciding whether it's worth trying to estimate a dose-response relation for X), but the treatment itself seems well defined.

Seth replied as follows:

Here are some relevant "facts":

Long ago, John Tukey said that he would rather have a sample of n = 3 (randomly selected) than Kinsey's really large non-random samples. He did not explain how one would get a randomly selected person to answer intimate questions. Once one considers that point Kinsey's work looks a little better -- because ANY actual sample will involve some compromise (probably large) with perfectly random sampling. Likewise, the closer one looks at the details of doing a study with n = 100, the more clearly one sees the advantages of smaller n studies.

How do the results of self-experimentation make their way in the world? An example is provided by blood-sugar testing for diabetics. Now it is everywhere -- "the greatest advance since the discovery of insulin," one diabetic told me. It began with self-experimentation by Richard Bernstein, an engineer at the time. With great difficulty, Bernstein managed to present his work at a scientific conference. It was then followed up by a British academic researcher, who began with relatively small n studies. I don't think he ever did a big study (e.g., n = 100). The benefits were perfectly clear with small n. From there it spread to become the norm. Likewise, I don't think that a really large study of my weight-loss ideas will ever be necessary. The benefits should be perfectly clear with small n. Fisher once said that what is really convincing is not a single study with a really low p value but repeated studies with p < .05. Likewise, I don't think that one study with n = 100 is half as convincing as several diverse studies with much smaller n.

It is so easy to believe that bigger is better (when in fact that is far from clear) that I wonder if it is something neurological: Our brains are wired to make us think that way. I cannot remember ever hearing a study proposed that I thought was too small; and I have heard dozens of proposed studies that I thought were too large. When I discussed this with Saul Sternberg, surely one of the greatest experimental psychologists of all time, he told me that he himself had made this very mistake: Gone too quickly to a large study. He wanted to measure something relatively precisely so he did an experiment with a large n (20 is large in cognitive psychology). The experiment failed to repeat the basic effect.

P.S. Seth's paper was also noted here.
See also here for Susan's comments.

No connection to statistics

From The Red Hot Typewriter: The Life and Times of John D. MacDonald, by Hugh Merrill:

A new book on R graphics

Jouni pointed me to a forthcoming book on statistical graphics in R, written by Paul Murrell at the University of Auckland (New Zealand). R is the open-source version of S and by far the best all-around computer package for statistical research and practice.

Based on the webpage, the book looks like it's going to be great. I was hoping to use it as one of the texts for my new course on statistical graphics, but now I'm thinking I'll also include it as a recommended text in all my classes. I particularly like Figure 1.8 (the "graphical table") which reminds me of my own work on turning tables into graphs.

More on Bayes in China

Here's an update of whether they didn't teach Bayesian statistics in China because the "prior distribution" violated the principles of communism:

Chuanhai writes, "Zaiying Huang and I took a Bayesian course taught in the department of Mathematics at Wuhan University in 1984-1985."

Hao writes, "Interesting. I didn't learn Bayes in China and never heard of this. But it sounds possible at that time."

Hongyu: "I did not hear this, I only learned the Bayes theorem but nothing else."

Tian:

In my only "mathematical statistics" course back in college, my teacher told us the philosophical views of Bayesian statistics without much detail, but it sounded very cool.

Mao's quote should be interpreted (in the most direct Chinglish way) as "the truth needs to be examined using empirical facts". So I don't it completely conflicts with the views of Bayesian statistics.

Just my 2 cents!

Finally, Xiao-Li clarifies:

It's not my teachers, but rather time (or generation!) differences. It was late 70th when I got to colleague, when the culture revolution just ended. And indeed, my teachers told me about this in reference to why they did not "dare" to study Bayes *during* culture revolution (or study anything else for that matter). By 84-85, things have changed considerably. Indeed, in 85, I took a seminar course at Fudan during which I learned empirical Bayes. And according to Don, that is why I was admitted because I wrote a personal statement on why I wanted to study empirically Bayes. Don said he was impressed because finally there was a Chinese student who did not just say how good his/her mathematics was, but of course retrospectively I have to confess that I really didn't know much about what I was talking about! :-)

Of course Xiao-Li is being modest. He understood everything, but just in Chinese, not English!

Bias in 2004 exit polls

Jeronimo pointed out this analysis by a bunch of statisticians comparing the 2004 exit polls with election results. The report (by Josh Mitteldorf, Kathy Dopp, and several others) claim an "absence of any statistically-plausible explanation for the discrepancy between Edison/Mitofsky’s exit poll data and the official presidential vote tally" and hence suggest that the vote itself may have been rigged.

Mittledorf et al. (hereafter, "US Count") present a number of arguments based on the results in the Edison/Mitofsky report that leave me intrigued but not convinced.

1. US Count starts with a histogram (on page 6 of their report) demonstrating that Bush outperformed the exit polls in most of the states. US Count then perform some implies some p-value calculations showing how unlikely this would be "less than 1 in 10,000,000" if the state errors were independent. But the errors are clearly a national phenomenon, so a calculation based on independent state errors misses the point. The real issue, as US Count recognizes elsewhere in its report, is: How plausible is it that Kerry voters responded to exit polls at a 6% higher rate than Bush voters, as would be needed to explain the errors?

2. US Count make various calculations of error rates in different precincts. These are interesting--at the very least, I don't think the patterns they find should be occurring if the poll is executed according to plan--but I don't see how they rule out an overall higher rate of response by Kerry than by Bush voters.

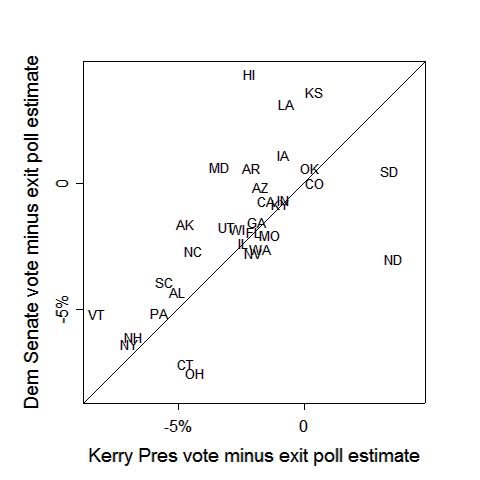
3. US Count notes that the exit polls predicted the Senate races better than the Presidential races in the states. Here are the errors (just for the 32 states in the data with Senate races):

exit1.png

(By the way, I give all error rates in terms of Democrats' share of the vote. Edison/Mitofsky gave errors in vote margin, which I found confusing. My numbers are just theirs divided by 2.)

Anyway, there is definitely something going on, but again it appears to be a national phenomenon. I'm not quite sure what sort of hypothesis of "cheating" would explain this.

Considering the US Votes hypothesis more carefully, it makes sense to look at the Edison/Mitofsky "composite estimates," which combine the exit poll with a "Prior Estimate, which is based upon analysis of the available pre-election surveys in each state." Unsurprisingly, these composite estimates are better (see page 20 of the Edison/Mitofsky report). And in assessing the hypothesis that the polls are OK but the votes were rigged, it makes sense to use these better estimates as a baseline.

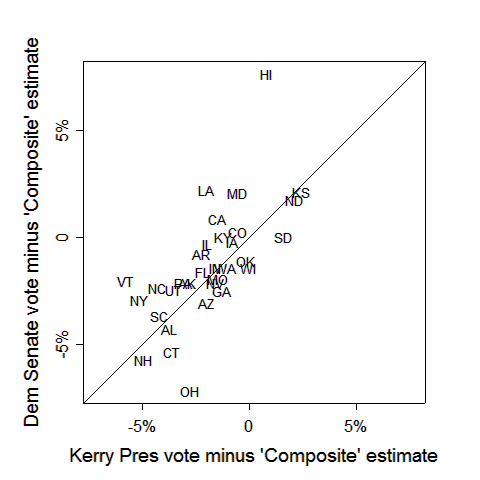
Here are the errors in the Presidential and Senate vote from the composite predictions (exit polls combined with pre-election polls):

exit2.png

Discrepancies have changed but are still there. One hypothesis for the differences between Presidential and Senate error, considered and dismissed by US Votes, is split-ticket voting. In fact, though, the states with more split-ticket voting (as crudely measured by the absolute difference between Democratic Senatorial and Presidential vote shares) do show bigger absolute differences between Senate and Presidential errors.

4. Discrepancies are lowest with paper ballots and higher with election machines. I don't know that there are any reasonable hypotheses of fraud occurring with all machines (mechanical, touch screen, punch cards, optical scan), so I'm inclined to agree with Edison/Mitofsky that these differences can be better explained by rural/urban and other differences between precincts with different types of polling equipment.

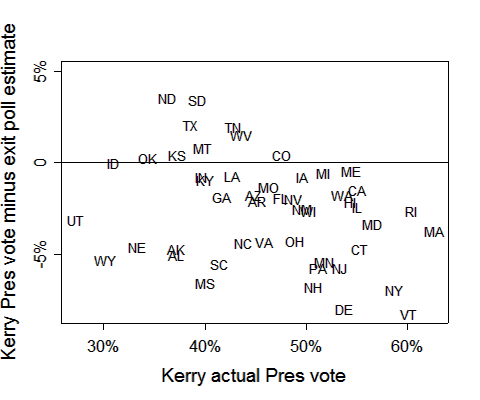
5. The exit poll data do show some strange patterns, though. Let's go back to the state-by-state errors in the Presidential vote for the 49 states in the data. Here's a plot of the state error vs. Kerry's vote share:

exit3.png

What gives with the negative slope (which is, just slightly, "statistically significant")? This is not what you'd expect to see if the poll discrepancies are entirely due to sampling error. With only sampling error, the poll gives a so-called unbiased estimate of the population average, and so the errors should be uncorrelated with the actual outcome.

This doesn't mean there was any election fraud. It just means that the exit poll estimates (above, I was using Edison/Mitofsky's "best Geo estimator"; their "within-precinct error" gives very similar results) are not simply based on a random sample of all ballots cast in a precinct. As Edison/Mitofsky note on page 31 of their report, there are sources of error other than random sampling, most notably differental nonresponse. Perhaps these factors include votes taken during hours when the exit pollsters weren't there or other coverage issues. In some elections, vote tallies are statistically stable over time, but it doesn't have to be that way. Or maybe there were some other adjustments going on with the polls.

Summary

US Votes is correct to point out an inherent contradiction in the Edison/Mitofsky report, which is that it blamed the exit polls for the discrepancy while at the same time not seeming to look hard enough to find out where the problems were occurring. (To me, the most interesting table of the Edison/Mitofsky report came on page 35, where they report average within-precinct errors of 3.3%, 0.9%, 1.2%, 2.5%, and 1.1%--all in favor of the Democrats--in the five most recent elections. (Again, I'm dividing all their numbers by 2 to give errors in vote proportion rather than vote differential.))

The errors appear to be nationwide and would seem to be more consistent with nonresponse and undercoverage rather than something more local such as fraud.

Just scanning the web, I found more on this here, here, here, here, and here.

As Jeronimo said
, let's just hope this doesn't happen in Mexico!

Full disclosure: Five years ago, I briefly consulted for Voter News Service and met Warren Mitofsky. I have no current conflicts of interest.

P.S. Mark Blumenthal discusses these issues here and here.

On January 19, 2005 the now well-known Edison Media Research and Mitofsky International (EM) organizations published a report that evaluated their exit-poll system for the National Election Pool (NEP). In a nutshell the report concluded that the discrepancies with the exit-polls and the actual vote tally was because those who voted for Bush were less likely than those who voted for Kerry to respond to the pollsters. This post-hoc theorizing is being challenged by a group of statisticians who argue that ”The required pattern of exit poll participation by Kerry and Bush voters to satisfy the E/M exit poll data defies empirical experience and common sense under any assumed scenario.” (p.12)

What would happen if this same situation happens in another country like Mexico? Think about it…

I'll be speaking at Harvard next Monday on some joint work with Tian Zheng, Matt Salganik, Tom DiPrete, and Julien Teitler:

Networks--sets of objects connected by relationships--are important in a number of fields. The study of networks has long been central to sociology, where researchers have attempted to understand the causes and consequences of the structure of relationships in large groups of people. Using insight from previous network research, McCarty, Bernard, Killworth, et al. (1998, 2001) developed and evaluated a method for estimating the sizes of hard-to-count populations using network data collected from a simple random sample of Americans. In this paper we show how, using a multilevel overdispersed Poisson regression model, these data can also be used to estimate aspects of social structure in the population. Our work goes beyond most previous research by using variation as well as average responses to learn about social networks and leads to some interesting results. We apply our method to the McCarty et al. data and find that Americans vary greatly in their number of acquaintances. Further, Americans show great variation in propensity to form ties to people in some groups (e.g., males in prison, the homeless, and American Indians), but little variation for other groups (e.g., people named Michael or Nicole). We also explore other features of these data and consider ways in which survey data can be used to estimate network structure.

Our paper is here. And here's a paper by McCarty, Killworth, Bernard, Johnsen, and Shelley describing some of their work that we used as a starting point. (They estimate average network size at 290 but we get an estimate, using their data, of 750. The two estimates differ in corresponding to different depths of the social network.) McCarty et al. were very collegial in sharing their data with us, which we reanalyzed using a multilevel model. Here's a presentation I found on the web from Killworth on this stuff.

Update: Our paper will appear in the Journal of the American Statistical Association.

More thoughts on self-experimentation

Susan writes:

I've started reading the piece you sent me on Seth. Very interesting stuff. I generally tend to think that one can get useful evidence from a wide variety of sources -- as long as one keeps in mind the nature of the limitations (and every data source has some kind of limitation!). Even anecdotes can generate important hypotheses. (Piaget's observations of his own babies are great examples of real insights obtained from close attention paid to a small number of children over time. Not that I agree with everything he says.) I understand the concerns about single-subject, non-blind, and/or uncontrolled studies, and wouldn't want to initiate a large-scale intervention on the basis of these data. But from the little bit I've read so far, it does sound like Seth's method might elicit really useful demonstrations, as well as generating hypotheses that are testable with more standard methods. But I also think it matters what type of evidence one is talking about -- e.g., one can fairly directly assess one's own mood or weight or sleep patterns, but one cannot introspect about speed of processing or effects of one's childhood on present behavior, or other such things.

So I clicked on the link on our webpage to Decision Science News, flipped through there and then on to his links . . . hmmm, a link to the psychologist Jon Baron, who studies thinking and decision making. . .

Stephen Coate (Dept. of Economics, Cornell) and Brian Knight (Dept. of Economics, Brown) wrote a paper, "Socially Optimal Redistricting," with a theoretical derivation of seats-votes curves. The paper cites some of my work with Gary King on empirically estimating seats-votes curves. Coate and Knight sent the paper to Gary, who forwarded it to me. It's an interesting paper but has a slight misrepresentation of what Gary and I did in studying seats-votes curves and redistricting.

A few years ago I picked up the book Virtual History: Alternatives and Counterfactuals, edited by Niall Ferguson. It's a book of essays by historians on possible alternative courses of history (what if Charles I had avoided the English civil war, what if there had been no American Revolution, what if Irish home rule had been established in 1912, ...).

There have been and continue to be other books of this sort (for example, What If: Eminent Historians Imagine What Might Have Been, edited by Robert Cowley), but what makes the Ferguson book different is that he (and most of the other authors in his book) are fairly rigorous in only considering possible actions that the relevant historical personalities were actually considering. In the words of Ferguson's introduction: "We shall consider as plausible or probable only those alternatives which we can show on the basis of contemporary evidence that contemporaries actually considered."

I like this idea because it is a potentially rigorous extension of the now-standard "Rubin model" of causal inference.

Postdoctoral position available

Postdoctoral research opportunity: Columbia University, Departments of Epidemiology and Statistics

Supervisors: Ezra Susser (epidemiology) and Andrew Gelman (statistics)

We have a NIH-funded postdoctoral position (1 or 2 years) available for what is essentially statistical research as applied to some important problems in psychiatric epidemiology. One project which we are working is the Jerusalem Perinatal Study of Schizophrenia, a birth cohort of about 90,000 (born 1966-1974) followed for schizophrenia in adulthood. Another project is a California birth cohort study of schizophrenia--this is a cohort of 20,000 collected in 1959-1966 for which we have ascertained/diagnosed 71 cases of schizophrenia spectrum disorders. The data set already exists and has produced several important findings. The statistical methods involve fitting and understanding multilevel models; see below. The position can also involve some teaching in the Statistics Department if desired.

Statistical Project 1: Tools for understanding and display of regressions and multilevel models

Modern statistical packages allow us to fit ever-more-complicated models, but there is a lag in the ability of applied researchers (and of statisticians!) to understand these models and check their fit to data. We are in the midst of developing several tools for summarizing regressions, generalized linear models, and multilevel models—these tools include graphical summaries of predictive comparisons, numerical summaries of average predictive comparisons, measures of explained variance (R-squared) and partial pooling, and analysis of variance. To move this work to the next stage we need to program the methods for general use (writing them as packages in the popular open-source statistical language R) and further develop them in the context of ongoing applied research projects.

Statistical Project 2: Deep interactions in multilevel regression

In regressions and generalized linear models, factors with large effects commonly have large interactions. But in a multilevel context in which factors can have many levels, this can imply many many potential interaction coefficients. How can these be estimated in a stable manner? We are exploring a doubly-hierarchical Bayes approach, in which the first level of the hierarchy is the usual units-within-groups (for example, patients within hospitals) in which coefficents are partially pooled and the second level is a hierarchical model of the variance components (so that the different amounts of partial pooling are themselves modeled). The goal is to be able to include a large number of predictors and interactions without the worry that lack-of-statistical-significance will make the estimates too noisy to be useful. We plan to develop these methods in the context of ongoing applied research projects.

If you are interested . . .

Please send a letter to Prof. Andrew Gelman (Dept of Statistics, Columbia University, New York, N.Y. 10027, gelman@stat.columbia.edu), along with c.v., copies of any relevant papers of yours, and three letters of recommendation.

Research, Google-style

In my correspondence with Boris about Barone's column about rich Democrats, I expressed surprise at Barone's statement that "Patriotism is equated with Hitlerism" (among leftists). Boris referred me to this article by Victor Davis Hanson which indeed has examples of leftists (and even moderate Democrats like John Glenn) comparing Bush to the Nazis.

But aren't the Democrats just following the lead of the Clinton-haters in the 1990s? Hansen says no:

The flood of the Hitler similes is also a sign of the extremism of the times. If there was an era when the extreme Right was more likely to slander a liberal as a communist than a leftist was to smear a conservative as a fascist, those days are long past. True, Bill Clinton brought the deductive haters out of the woodwork, but for all their cruel caricature, few compared him to a mass-murdering Mao or Stalin for his embrace of tax hikes and more government. “Slick Willie” was not quite “Adolf Hitler” or “Joseph Stalin.”

Hmmm . . . this got me curious, so I followed Hansen's tip and did some Google searches:

bush hitler: 1.5 million
clinton hitler: 0.7 million

What about some other comparisons?

bush god: 8.6 million
clinton god: 3.4 million

So Bush is both more loved and hated than Clinton, perhaps. But then again, there's been a huge growth in the internet in the past few years, so maybe more Bush than Clinton for purely topical reasons?

bush: 83 million
clinton: 25 million

Hmm, let's try something completely unrelated to politics:

bush giraffe: 180,000
clinton giraffe: 23,000

OK, maybe not a good comparison, since giraffes live in the bush. Let's try something that's associated with Clinton but not with Bush:

bush mcdonalds: 440,000
clinton mcdonalds: 200,000

At this point, I'm getting the clear impression that Bush is getting more hits than Clinton on just about everything! So no evidence here that he's being Hitlerized more than Clinton was. It looks like the big number for "bush hitler" is more of an artifact of the spread of the web. [Place disclaimers here about the use of Google as a very crude research tool!]

This certainly doesn't invalidate, or even argue against, Hansen's main points. It just suggests that we should be similarly concerned about haters on the other side.

OK, I guess that's enough on this topic . . . maybe a good example for statistics teaching, though? Googlefighting as data analysis? Perhaps Cynthia Dwork, David Madigan, or some other student of web rankings can come up with more sophisticated analyses.

P.S. Update with discussion here.

P.S. Much much more on this general topic here, and here.

Boris forwarded to me this article by Michael Barone on "the trustfunder left." Some excerpts:

Who are the trustfunders? People with enough money not to have to work for a living, or not to have to work very hard. . . . These people tend to be very liberal politically. Aware that they have done nothing to earn their money, they feel a certain sense of guilt. . . . they are citizens of the world with contempt for those who feel chills up their spines when they hear "The Star Spangled Banner." . . . Where can you find trustfunders? Not scattered randomly around the country, but heavily concentrated in certain areas. . . . Trustfunders stand out even more vividly when you look at the political map of the Rocky Mountain states. In Idaho and Wyoming, each state's wealthiest county was also the only county to vote for John Kerry . . . Massachusetts Catholics gave their fellow Massachusetts Catholic Kerry only 51 percent of their votes, but he won 77 percent in Boston, 85 percent in Cambridge, and 69 percent and 73 percent in trustfunder-heavy Hampshire and Berkshire Counties in the western mountains. . . .

Rich states and counties mostly support the Democrats, but rich voters mostly support the Republicans

This is vivid writing but, I think, incorrect electoral analysis. Barone is making the common error of "personifying" states and counties. Since 1996, and especially since 2000, rich states and rich counties have tended to support the Democrats--but rich voters have continued to support the Republicans.

For example, as David Park found looking through the exit polls, the 2004 election showed a consistent correlation between income and support for the Republicans, with Bush getting the support of 36% of voters with incomes below $15,000, 14% of those with incomes between $15-30,000, . . . and 62% of those with incomes above $200,000.

Given these statistics, I strongly doubt that trustfunders--in Barone's words, "people with enough money not to have to work for a living, or not to have to work very hard"--are mostly liberal, as he claims. Of course it's possible, but the data strongly support the statements that (a) richer people tend to support the Republicans, but (b) voters in richer states (and, to some extent, counties) tend to support Democrats. There definitely are differences between richer and poorer states--but the evidence is that, within any state, the richer voters tend to go for the Republicans. See here for more.

Confusion of the columnists

My first thought on seeing Barone's article was disappointment that the author of the Almanac of American Politics would write something so misinformed. However, other columnists have made the same mistake. For example, here's here's Nicholas Kristof in the New York Times.

The interesting thing is that the conceptual confusion between patterns among states and among individuals (sometimes called the "ecological fallacy" or "Simpson's paradox" in statistics) led Barone to confusion even at the state and county level. For example, he writes,

Where Democrats had a good year in 2004 they owed much to trustfunders. In Colorado, they captured a Senate and a House seat and both houses of the legislature. Their political base in that state is increasingly not the oppressed proletariat of Denver, but the trustfunder-heavy counties that contain Aspen (68 percent for Kerry), Telluride (72 percent) and Boulder (66 percent). . . .

I went and looked it up. Actually, Kerry got 70% of the vote in Denver.

What's going on?

How can Barone, an experienced observer who knows a lot more about voting patterns than I do, make this mistake--not recognizing that rich people are voting for Republicans and not even noticing that Kerry got 70% of the vote in Denver? I think the fundamental problem, both of conservatives like Barone and liberals on the other side, is not coming to grips with the basic fact that both parties have close to 50% support.

Perhaps the Democrats are the party of trustfunders, welfare cheats, drug addicts, communists, and whatever other categories of people you don't like. Perhaps the Republicans are the party of rich CEO's, bigots, fascists, and so forth. No matter how you slice it, both sides have to add up to 50%, so you either have to throw in a lot of "normal" voters on both sides or else you have to marginalize large chunks of the population.

For example, Barone notes that Kerry won only 51% of the Catholic votes in Massachusetts. That looks pretty bad--he's so unpopular that he barely got the support of voters of his own state and religion. But, hey, he got 48% of the vote national vote, so somebody was voting for him. And considering that Bush got 62% of the voters with incomes over $200,000, Kerry's voters can't all be trustfunders!

Barone might be right, however, when he cites the trustfunders as a new source of money for the Democrats (as they of course also are for the Republicans). And, as a political matter, it might very well be a bad thing if both political parties are being funded by people from the top of the income distribution. This would be an interesting thing to look at. There's a wide spectrum of political participation, ranging from voting, to campaign contributions, to activism (see Verba, Schlozman, and Brady), and the demographics of these contributors and activists is potentially important. But you're not going to find it by looking at state-level or county-level vote returns.

Reasoning by analogy?

I clicked through to the link on Barone's page to his book, "Hard and Soft America." This looks much more reasonable. I wonder if he caught on to something real with "Hard America, Soft America" and then too quickly generalized it to imply, "anyone I agree with is part of hard America, which I like" and "anyone I disagree with is part of Soft America, which I dislike."

It wouldn't be the first time that a smart person was led by ideology to overgeneralize.

P.S. See also here, here, and here, and here for various takes on Barone's article.

Question about causal inference

Judea Pearl (Dept of Computer Science, UCLA) spoke here Tuesday on "Inference with cause and effect." I think I understood the method he was describing but it left me with some questions about what were the method's hidden assumptions. Perhaps someone familiar with this approach can help me out here.

I'll work with a specific example from my one of my current research projects.

Decision Science News

Dan Goldstein, who runs the Center for Decision Sciences seminar at Columbia (along with Dave Krantz and Elke Weber) has a blog called Decision Science News.

My favorite examples all in one place

I got a call from Joe Ax, a reporter at the (Westchester) Journal News because there had recently been two different tied elections in the county. (See here for some links.) He wanted my estimate of the probability of a tied election. Well, there were actually only about 1000 votes in each election, so the probability of a tie wasn't so low. . . . (For an expected-to-be-close election with n voters, i estimate Pr(tie) roughly as 5/n. This is based on, first, the assumption that there is a 1/2 probability of an even number of votes for the 2 candidates (otherwise you can't have a tie), and then on the assumption that the outcome is roughly equally-likely to be between 45% and 55% for either candidate. Thus 1/2 x 10/n = 5/n.)

I also mentioned that some people would calculate the probability based on coin flipping, but I don't like that because it asssumes that everyone's probability is 1/2 and that voters are independent, neither of which is true (and also the coin-flipping model doesn't come close to fitting actual election data).

Coin flips and babies

An hour or so later Joe called me back and said that he'd mentioned this to some people, and someone told him that he'd heard that actually heads are slightly more common than tails. What did I think of this? I replied that heads and tails are equally likely when a coin is flipped (although not necessarily when spun), but maybe his colleague was remembering the fact that births are more likely to be boys than girls.

P.S. Here's the Journal News article (featuring my probability calculations).

Bayes in China

Xiao-Li confirmed that they didn't like Bayes in China (or at least in Shanghai) when he was a student. He writes:

Yes, I do [remember], and it's no laughing matter then! What happened was that the notion of "prior" contradicted one of Mao's quotation "truth comes out of empirical/practical evidence" (my translation is not perfect, but you can get the essence) -- and anything contradicts what Mao said was banned!

Do any other Chinese statisticians have stories like this?

Lowess is great

One of the discussants in Brain and Behavioral Sciences of Seth Roberts's article on self-experimentation was by Martin Voracek and Maryanne Fisher. They had a bunch of negative things to say about self-experimentation, but as a statistician, I was struck by their concern about "the overuse of the loess procedure." I think lowess (or loess) is just wonderful, and I don't know that I've ever seen it overused.

Curious, I looked up "Martin Voracek" on the web and found an article about body measurements from the British Medical Journal. The title of the article promised "trend analysis" and I was wondering what statistical methods they used--something more sophisticated than lowess, perhaps?

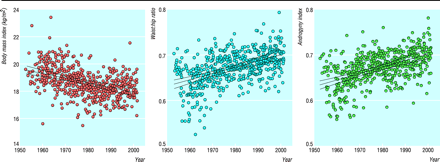
They did have one figure, and here it is:

vorm2338.f1.gif

Voracek and Fisher, the critics of lowess, are fit straight lines to data to clearly nonlinear data! It's most obvious in their leftmost graph. Voracek and Fisher get full credit for showing scatterplots, but hey . . . they should try lowess next time! What's really funny in the graph are the little dotted lines indicating inferential uncertainty in the regression lines--all under the assumption of linearity, of course. (You can see enlarged versions of their graphs at this link.)

As usual, my own house has some glass-based construction and so it's probably not so wise of me to throw stones, but really! Not knowing about lowess is one thing, but knowing about it, then fitting a straight line to nonlinear data, then criticizing someone else for doing it right--that's a bit much.

Not just lowess

Just to be clear, when I say "lowess is great," I really mean "smoothing regression is great"--lowess, also splines, generalized additive models, and all the other things that Cleveland, Hastie, Tibshirani, etc., have developed. (One of the current challenges in Bayesian data analysis is to integrate such methods. Maybe David Dunson will figure it all out.)

bugs.R question

This one's just for the bugs.R users out there . . .

Learning from self-experimentation

Seth Roberts is a professor of psychology at Berkeley who has used self-experimentation to generate and study hypotheses about sleep, mood, and nutrition. He wrote an article in Behavioral and Brain Sciences describing ten of his self-experiments. Some of his findings:

Seeing faces in the morning on television decreased mood in the evening and improved mood the next day . . . Standing 8 hours per day reduced early awakening and made sleep more restorative . . . Drinking unflavored fructose water caused a large weight loss that has lasted more than 1 year . . .

As Seth describes it, self-experimentation generates new hypotheses and is also an inexpensive way to test and modify them. One of the commenters, Sigrid Glenn, points out that this is particularly true with long-term series of measurements that it might be difficult to do on experimental volunteers.

Heated discussion

Behavioral and Brain Sciences is a journal of discussion papers, and this one had 13 commmenters and a response by Roberts. About half the commenters love the paper and half hate it. My favorite "hate it" comment is by David Booth, who writes, "Roberts can swap anecdotes with his readers for a very long time, but scientific understanding is not advanced until a literature-informed hypothesis is tested between or within groups in a fully controlled design shown to be double-blind." Tough talk, and controlled experiments are great (recall the example of the effects of estrogen therapy), but Booth is being far too restrictive. Useful hypotheses are not always "literature-informed," and lots has been learned scientifically by experiments without controls and blindness. This "NIH" model of science is fine but certainly is not all-encompassing (a point made in Cabanac's discussion of the Roberts paper).

The negative commenters were mostly upset by the lack of controls and blinding in self-experiments, whereas the positive commenters focused on individual variation, and the possibility of self-monitoring to establish effective treatments (for example, for smoking cessation) for individuals.

In his response, Roberts discusses the various ways in which self-experimentation fits into the landscape of scientific methods.

My comments

I liked the paper. I followed the usual strategy with discussion papers and read the commentary and the response first. This was all interesting, but then when I went back to read the paper I was really impressed, first by all the data (over 50 (that's right, 50) scatterplots of different data he had gathered), and second by the discussion and interpretation of his findings in the context of the literature in psychology, biology, and medicine.

The article has as much information as is in many books, and it could easily be expanded into a book ("Self-experimentation as a Way of Life"?). Anyway, reading the article and discussions led me to a few thoughts which maybe Seth or someone else could answer.

First, Seth's 10 experiments were pretty cool. But they took ten years to do. It seems that little happened for the first five years or so, but then there were some big successes. It would be helpful to know if he started doing something in last five years that made his methods more effective. If someone else wants to start self-experimenting, is there a way to skip over those five slow years?

Second, his results on depression and weight control, if they turn out to generalize to many others, are huge. What's the next step? Might there be a justification for relatively large controlled studies (for example, on 100 or 200 volunteers, randomly assigned to different treatments)? Even if the treatments are not yet perfected, I'd think that a successful controlled trial would be a big convincer which could lead to greater happiness for many people.

Third, as some of the commenters pointed out, good self-experimentation includes manipulations (that is, experimentation) but also careful and dense measurements--"self-surveillance". If I were to start self-experimentation, I might start with self-surveillance, partly because the results of passive measurements might themselves suggest ideas. All of us do some self-experimentation now and then (trying different diets, exercise regimens, work strategies, and soon). Where I suspect that we fall short is in the discipline of regular measurements for a long enough period of time.

Finally, what does this all say about how we should do science? How can self-experimentation and related semi-formal methods of scientific inquiry be integrated into the larger scientific enterprise? What is the point where researchers should jump to a larger controlled trial? Seth talks about the benefits of proceeding slowly and learning in detail, but if you have an idea that something might really work, there are benefits in learning more about it sooner.

P.S. Some of Seth's follow-up studies on volunteers are described here (for some reason, this document is not linked to from Seth's webpage, but it's referred to in his Behavioral and Brain Sciences article).

One of the major figures in Segerstrale's book is John Maynard Smith, who she refers to as "Maynard Smith." Shouldn't it be just "Smith"? Perhaps it's a British thing? When reading about 20th century English history, I always wondered why David Lloyd George was called "Lloyd George" rather than simply "George," but I figured that was just to avoid confusing him with the king of that name.

Still more on science and ideology

In the comments to this entry, Aleks points out that the correlations between scientific views and political ideology are not 100%, even at any particular point in time. (In my earlier entry, I had discussed how these political alignments have shifted over time.)

The question then arises: why care about this at all? Why not just evaluate the science on scientific grounds and ignore the ideology?

Yanan Fan, Steve Brooks, and I wrote a paper on using the score statistic to assess convergence of simulation output, which will appear in Journal of Computational and Graphical Statistics. The idea of the paper is to make use of certain identies involving the derivative of the logarithm of the target density. The paper introduces two convergence diagnostics. The first method uses the identity that the expected value of this derivative should be zero (if one is indeed drawing from the target distribution). The second method compares marginal densities estimated empirically from simulation draws to those estimated using path sampling. For both methods, multiple chains can be used to assess convergence using these methods, as we illustrate using some examples.

Well, now that I'm telling stories . . . When reading "Defenders of the Truth", I came across the name of Stephen Chorover--he was one of the left-wing anti-sociobiology people. As a freshman at MIT, I took introductory psychology (9.00, I believe it was), and Chorover was one of the two professors. He would give these really vague lectures--the only thing I remember was when he told us about his experiences with mescaline. He said something like, "I don't recommend that you take drugs, but the only way you'll know what it's like is to try it." Seemed like a real burned-out 60's type. (The course was co-taught, and the other prof was a young guy named Jeremy Wolfe, who was a dynamic lecturer but unfortunately spent all his time talking about perception, mostly vision, which might be interesting but certatinly wasn't why a college freshman is taking psychology.) The course also had a weekly evening meeting that was in a room too small for us all to fit in, because, they told us, "we know you won't show up anyway." Another great message to send to the freshmen . . .

(I really shouldn't go around mocking college instructors since I know I have my own flaws. In the first semester of teaching, one of the students came up to me at the end of the semester and said, "Don't worry, Prof. Gelman. You'll do a better job teaching next time.")

Anyway, it was just funny to see Chorover's name in print after so many years. Also, Steven Pinker gave a guest lecture in that intro psych class of ours, but that was before he became political.

Science and ideology

Writing about the changing nature of science and ideology (see also here) reminds me that in grad school, Joe Schafer used to talk about the "left-wing Bayesians" and the "right-wing frequentists," which might even have been true although I can't see any scientific reason for such an alignment. I mean, I can see a lot of rationalizations (for example, Bayesian inference was more of a new, maybe risky, approach, hence perhaps would be more popular with radicals than with conservatives), but they don't seem so convincing to me.

I also remember that Xiao-Li Meng told me that in China they didn't teach Bayesian statistics because the idea of a prior distribution was contrary to Communism (since the "prior" represented the overthrown traditions, I suppose). Or maybe he was pulling my leg, I dunno.

Contingency and ideology

Following Bob O'Hara's recommendation, I read Defenders of the Truth: The Battle for Science in the Sociobiology Debate and Beyond, by Ullica Segerstrale. As Bob noted in his comment, this is a story of a bunch of scientists who managed to have a highly ideological debate about evolutionary theory despite all being on the left side of the political spectrum (sort of like that famous scene from The Life of Brian with the Judean People's Front).

Nature vs. nurture, right vs. left

Anyway, I wanted to use this to continue the discussion of science and political ideology.

p (A|B) != p (B|A)

A common mistake in conditional probability is to confuse the conditioning (that is, to mistake p(A|B) for p(B|A)). One complication here is that our language for probability can be ambiguous. For example, I have done a classroom demo replicating the experiment of Kahneman and Tversky in which students guess "the percentage of African countries in the United Nations." I always thought this meant
100*(# African countries in U.N.)/(# countries in U.N.).
But some students thought this meant
100*(# African countries in U.N.)/(# countries in Africa).
So, to even ask the question clearly, I need to ask for "the percentage of countries in the U.N. that are in Africa," or something like that.

Anyway, I recently went to a talk by Maryanne Schretzman (Dept of Homeless Services, NYC), where an interesting example arose of the difference between p(A|B) and p(B|A). They're looking at new admissions to the shelter system, and a lot of them come are people who are released from jail. But the jail administrators aren't so interested in talking about this, because, of all the people released from jail, only a small percentage go to homeless shelters. p(A|B) is high, but p(B|A) is small. Same numerators, but the denominator is much bigger in the latter case.

Following up on this and this and this , Dan Ho sent me the following discussion of the differences between his, Jasjeet Sekhon's, and Ben Hansen's matching programs:

The secret weapon

An incredibly useful method is to fit a statistical model repeatedly on several different datasets and then display all these estimates together. For example, running a regression on data on each of 50 states (see here as discussed here), or running a regression on data for several years and plotting the estimated coefficients over time.

Here's another example:

figure8 (464 x 600).png

I was reading something the other day that referred in an offhand way to "meritocracy", which reminded me of a wide-ranging and interesting article by James Flynn (the discoverer of the "Flynn effect", the steady increase in average IQ scores over the past sixty years or so). Flynn's article talks about how we can understand variation in IQ within populations, between populations, and changes over time.

At the end of his article, Flynn gives a convincing argument that a meritocracatic future is not going to happen and in fact is not really possible.

EDA for HLM

Matching and matching

Is voting contagious?

David Nickerson sent me the following message:

I saw your post from February 3rd complaining about the lack of connection between social networks and voter turnout. I'm just finishing up my dissertation in political science at Yale (under Don Green) before starting at Notre Dame next year. The dissertation is on behavioral contagion and a couple of chapters look at voter turnout. Attached is one chapter describing a randomized field experiment I conducted to determine how the degree to which voting is contagious within a household. You might find it of interest (though the network involved is fairly small).

I'm also working with Dean Karlan (from Princeton economics) to
broaden the scope of contagion experiments to see whether voting is
contagious across households (and if so, how far). We're at the beginning stages of the research, but think it might be fruitful.

At the very least, I'm approaching the topic from a very different
direction from Meredith Rolfe (whose work looks interesting). I thought you'd be interested to see that at least one other graduate student is working on linking social networks to voting behavior.

International data

Contingency and alternative history

This might not seem like it has much connection to statistics, but bear with me . . .

Alternative history--imaginings of different versions of this world that could have occurred if various key events in the past had been different--is a popular category of science fiction. Alternative history stories come in a number of flavors but a common feature of the best of the novels in this subgenre is that the alternate world is not "real."

Let's consider the top three alternative history novels (top three not in sales but in critical reputation, or at least my judgment of literary quality): The Man in the High Castle, Pavane, and Bring the Jubilee. (warning: spoilers coming)

Causal inference and decision trees

Causal inference and decision analysis are two areas of statistics in which I've seen very little overlap: the work in causal inference is typically very "foundational" with continuing reassessment based on first principles, whereas decision analysis is more of meat-and-potatoes Bayesian inference--slap down a probability model, stick in a utility function, and turn the crank. (With all this processing, this must be ground beef and mashed potatoes.)

Actually, though, causal inference and decision analysis are connected at a fundamental level. Both involve manipulation and potential outcomes. In causal inference, the "causal effect" (or, as Michael Sobel would say, the "effect") is the difference between what would happen under treatment A and what would happen under treatment B. The key to this definition is that either treatment could be applied to the experimental unit by some agent (the "experimenter").

In parallel, decision analysis concerns what would happen if decision A or decision B were chosen. When drawing decision trees, we let squares and circles represent decision and uncertainty nodes, respectively. To map on to causal inference, the squares would represent potential treatments and the circles would represent uncertainty in outcomes--or population variability.

In practice, the two areas of research are not always so closely connected. For example, in our decision analysis for home radon, the key decision is whether to remediate your house for radon. The causal effect of this decision on reducing the probability of lung cancer death is assumed to follow a specified functional form as estimated from previous studies. For our decision analysis we don't worry about too much about the details of where that estimate came from.

But in thinking about causal effects, the decision-making framework might be helpful in distinguishing among different possible potential-outcome frameworks.

Jasjeet Sekhon reports:

I recently released a new version of my Matching package for R. The new version has a function, called GenMatch(), which finds optimal balance using multivariate matching where a genetic search algorithm determines the weight each covariate is given. The function never consults the outcome and is able to find amazingly good balance in datasets where human researchers have failed to do so. I'm writing a paper on this algorithm right now.

The software, along with some examples, is here.

We also had a discussion of matching a few months ago on the blog.

Bayes for medical diagnosis

Here's a cool little paper by Christopher Gill, Lora Sabin, and Chris Schmid, on the use of Bayesian methods for medical diagnosis. (The paper will appear in the British Medical Journal.) The paper has a very readable explanation of Bayesian reasoning in a clinical context.

I don't really agree with their claim that "clinicians are natural Bayesians" (see here for my comments on that concept) but I agree that Bayesian inference seems like the right way to go, at least in the examples discussed in this paper.

More on social networks and voting

I had a little dialogue with Meredith Rolfe after reading her papers on political participation and social networks:

Bayesian modeling for kidney filtering

Chris Schmid (statistics, New England Medical Center) writes:

We're trying to make a prediction equation for GFR which is the rate at which the kidney filters stuff out. It depends on a bunch of factors like age, sex, race and lab values like the serum creatinine level. We have a bunch of databases in which these things are measured and know that the equation depends on factors such as presence of diabetes, renal transplantation and the like. Physiologically, the level of creatinine depends on the GFR but we can measure creatinine more easily than GFR so want the inverse prediction. Two complicating factors are measurement error in creatinine and GFR as well as the possibility that the doctor may have some insight into the patient's condition that may not be available in the database. We have been proceding along the lines of linear regression, but I suggested that a Bayesian approach might be able to handle the measurement error and the prior information. I'm attaching some notes I wrote up on the problem.

So, we have a development dataset to determine a model, a validation set to test it on and then new patients on whom the GFR would need to be predicted as well as some missing data on potential important variables. What I am not clear about is how to use a prior for the prediction model, if this uses information not available in the dataset. So we'd develop a Bayesian scheme for estimating the posteriors of the regression coefficients and true unknown lab values but would then need to apply it to single individuals with measure of creatinine and some covariates. The prior on the regression parameters would come from the posterior of the data analysis, but wouldn't the doctor's intuitive sense of the GFR level need to be incorporated also and since it's not in the development dataset, how would that be done? It seems to me that you'd need a different model for the prediction than for the data analysis. Or is it that you want to use the data analysis to develop good priors to use in a new model?

A Bayesian approach would definitely be the natural way to handle the measurement error. I would think that substantive prior information (such as doctor's predictions) could be handled in some way as regression predictors, rather than directly as prior distributions. Then the data would be able to assess, and automatically calibrate, the relevance of these predictors for the observed data (the "training set" for the predictive model).

Any other thoughts?

Power calculations

I've been thinking about power calculations recently because some colleagues and I are designing a survey to learn about social and political polarization (to what extent are people with different attitudes clustered in the social network?). We'd like the survey to be large enough, and with precise enough questions, so that we can have a reasonable expectation of actually learning something useful. Hence, power calculations.

Carrie McLaren of Stay Free magazine had a self-described "rant" about Blink, the new book by science writer Malcolm Gladwell. I'll give Carrie's comments below, but my interest here isn't so much in Gladwell's book (which seems really cool) or Carrie's specific comments (which are very thought-provoking, and she also points to this clarifying discussion by Gladwell and James Surowecki in Slate magazine).

Political ideology and attitudes toward technology

Right now, though, I'm more interested in what these exchanges reveal about the intersections of political ideology and attitudes toward technology. Historically, I think of technology as being on the side of liberals or leftists (as compared with conservatives who would want to stick with the old ways). Technology = "the Enlightenment" = leftism, desire for change, etc. Even into the 20th century, I'd see this connection, with big Soviet steel factories and New Deal dams. But then, in the 1960s and 1970s?, it seems to me there was a flip, in which technology is associated with atomic bombs, nuclear power, and other things that are more popular on the right than on the left. The environmentalist left has been more skepical about technological solutions. In another area of scientific debate, right-leaning scientists have embraced sociobiology and related ideas of bringing genetics into social policy.

But...perhaps recently things have switched back? In battles over the teaching of evolution, it is the liberals who are defending the scientific method and conservatives who are holding back, wanting to respect local culture rather than scientific universals. Similarly with carbon dioxide and climate change.

But, again, I'm not trying here to argue the merits of any of these issues but rather to ask whether it is almost a visceral thing, at any point in time, with one's political allegiances being associated with a view of science.

Is Gladwell's argument inherently anti-rational? Is anti-rationality conservative?

This is what I saw in Carrie's posting on Gladwell. She was irritated by his use of scientific studies to support a sort of irrationalism--a favoring of quick judgments instead of more reasoned analyses. From this perspective, Gladwell's apparent advocacy of unconscious decisions is a form of conservatism. (His position seems more nuanced to me, at least as evidenced in the Slate interview--where he suggests sending police out individually instead of in pairs so they won't be emboldened to overreact--but perhaps Carrie's take on it is correct in the sense that she is addressing the larger message of the book as it is perceived by the general public, rather than any specific attitudes of Gladwell.)

Rationality and ideology

As a larger issue, in the social sciences of recent decades, I think of belief in rationality and "rational choice modeling" as conservative, both in the sense that many of the researchers in this area are politically conservative and in the sense that rationality is somehow associated with "cold-hearted" or conservative attitudes on cost-benefit analyses. But at the same time, quantitative empirical work has been associated with left-leaning views--think of Brown v. Board of Education, or studies of income and health disparities. There's a tension here, because in the social sciences, the people who can understand the technical details of empirical statistical work are the ones who can understand rational choice modeling (and vice versa). So I see all this stuff and keep getting bounced back and forth.

(I'm sure lots has been written about this--these ideas are related to a lot of stuff that Albert Hirschman has written on--and I'd appreciate relevant references, of course. Especially to empirical studies on the topic.)

Reducing arsenic exposure in Bangladesh

Mythinformation

"Women's Work: The First 20,000 Years" is one of the coolest books I've ever read, and so I was thrilled to find that Elizabeth Wayland Barber has just come out with a new book (coauthored with her husband, Paul Barber), "When They Severed Earth from Sky : How the Human Mind Shapes Myth". This one's also fascinating. The topic this time is myths or, more generally, stories passed along orally, sometimes for thousands of years. No statistical content here (unless you want to think of statistics very generally as an "information science"; there is in fact some discussion about the ways in which information can be encoded in a way that can be remembered in stories), so it's hard for me to evaluate their claims, but it all seems reasonable to me.

Having read this book, I have a much better sense of the sense in which these stories can be informative without being literally true (in fact, without referring to any real persons in many cases).

Parent to children asset transfers

A few words to complement what has been said:
In econ, asset and income are thought of as stock and flow, respectively, and are related through some formula asset=f(future incomes), so I find it sensible to explain any discrepancy between the lhs and rhs by other factors...less so in practice: proxies for the lhs and the rhs are only as good as stock prices and accounting statements, respectively, in reflecting economic value...

In a social context, it would be necessary to know what is included in assets, and income. For example, it has been said that there are relatively few material asset transfers within US families, but what if investment in education is included? In comparison, this isn't discretionary in many other countries, as it is financed by taxation.

Another example: an increase in national debt can be thought of as a transfer in wealth from juniors to seniors, again complicating the definition of asset transfers.

Esther Duflo (economics, MIT) just gave a talk here at the School of Social Work, on "political reservations" for women and minorities--that is, electoral rules that set aside certain political offices for women and ethnic minorities. Different countries have different laws along these lines, for example reserving some percentage of members of a legislature for women.

An almost-randomized experiment in India

Duflo talked about a particular plan in India which reserved to women, on a rotating basis, one-third of Village Council head positions. Each election (elections are held every five years), a different one-third of the villages must elect women leaders. (There was also some reservations for ethnic minorities but she did not go into detail on that in her talk.)

Duflo's findings

Duflo and her colleagues took advantage of the fact that this system is a "natural experiment," with an essentially random 1/3 of the villages being selected for the treatment each year. They compared the "treated" and "control" villages using data from a national survey to assess the quality and perceptions about public services in the villages. The survey also included objective measures of the quality and quantity of the services (water, education, transportation, fair price shops, and public health facilities). These objective measures were crucial because they allowed the researchers to distinguish between perceptions and reality.

They found that, on average, the quantity and quality of the services were higher in the villages whose leaders were restricted to be women. There's a lot of variation among villages, and as a result the average differences are not large compared to the standard errors
(the avg difference in quantity of services is 1.9 se's away from 0, and the avg difference in quality of services is 1.5 se's away from 0). So they'd be characterized as "suggestive" rather than "statistically significant," I'd say. Nonetheless, it's interesting to see this improvement in performance. Because the treatment was essentially randomized (every third village on a list was selected), it would seem reasonable to attribute these changes to the treatment and not to unmeasured observational factors.

OK, so far so good. But here's something else: they also compared the satisfaction of survey respondents in the villages. On average, people in the villages that were restricted to be headed by women were less satisfied about the public services. This also was barely "statistically significant" (people were, on average, 2% less satisfied, with a standard error of 1%) but interesting. Duflo cited a bunch of papers on biased judgment which suggest that people may very well judge women to be poor leaders, even if they outperform men in comparable positions.

Thus, it seems quite plausible from the data that reserving leadership positions for women could be beneficial--even if the people receiving these benefits don't realize it!

Some statistical comments

As Duflo emphasized in her talk, the #1 reason they could do a study here was that the "treatment" of reserving political spaces for women was essentially randomly assigned across villages. Random assignment is good, also assigning across villages is good because it gives a high N (over 900).

There are a couple ways in which I think the analysis could be improved. First, I'd like to control for pre-treatment measurements at the village level. Various village-level information is available from the 1991 Indian Census, including for example some measures of water quality. I suspect that controlling for this information would reduce the standard errors of regression coefficients (which is an issue given that most of the estimates are less than 2 standard errors away from 0). Second, I'd consider a multilevel analysis to make use of information available at the village, GP, and state levels. Duflo et al. corrected the standard errors for clustering but I'd hope that a full multilevel analysis could make use of more information and thus, again, reduce uncertatinties in the regression coefficients.

References

Duflo's papers on this are here and (with Petia Topalova) here and (with Raghabendra Chattopadhyay) here.

FAQ on DIC and pD in bugs and bugs.R

DIC (the Deviance Information Criterion of Spiegelhalter et al.) is a good idea and, I think, the right way to generalize AIC (the Akaike Information Criterion) when trying to get a rough estimate of predictive accuracy for complex models. We discuss DIC in Section 6.7 of Bayesian Data Analysis (second edition) and illustrate its use with the 8-schools example.

However, some practical difficulties can arise:

1. In the examples I've worked on, pD and DIC are computationally unstable. You need a lot more simulations to get a good estimate of pD and DIC than to get a good estimate of parameters in the model. If the simulations are far from convergence, the estimates of pD and DIC can be particularly weird.

Because of this instability, I don't actually recommend using DIC to pick a model. Actually, I don't recommend the use of any automatic criterion to pick a model (although, if I had to choose a criterion, I'd prefer a predictive-error measure such as DIC, rather than something like BIC that I don't fully understand). But I can see that DIC could be useful for understanding how a set of models fit together.

2. bugs and bugs.R use different formulas for pD. bugs uses the formula from Spiegelhater et al, whereas bugs.R uses var(deviance)/2 Asymptotically, both formulas are correct, but with finite samples I really don't know. I'd expect that the Spiegelhalter et al. formula is better--I say this just because they've thought harder about these things than I have, and I assume they came up with their formula for good reasons! The reason why I used a different formula is that the bugs output does not, in general, provide enough info, in general, for me to compute their formula.

A Very Delayed Lightbulb Over my Head

Daniel Scharfstein (http://commprojects.jhsph.edu/faculty/bio.cfm?F=Daniel&L=Scharfstein) recently gave a very good talk at the Columbia Biostatistics Department. He presented an application of causal inference using principal stratification. The example was similar to something I've heard Don Rubin and others speak about before, but I realized I'd been missing something important about this particular example.

Agressive treatment, agressive teaching

Atul Gawande wrote an interesting article in the New Yorker a couple months ago on the varying effectiveness of medical centers around the U.S. in treating cystic fibrosis (CF), a genetic disease that reduces lung functioning in children. Apparently, the basic treatment is the same everywhere--keep the kid's lungs as clear as possible, from an early age--but some hospitals are much better at it than others: "In 2003, life expectancy with CF had risen to thirty-three years nationally, but at the best center it was more than forty-seven."

I'll discuss the article and give a long quote from it, then give my thoughts.

Agressive doctors

Gawande goes to an average-performing center (in Cincinnati) and the nuber-one center (in Minneapolis) and inteviews and observes people at both places. The difference, at least in how he reports it, is that in the top center the doctors are super-agressive and really involved with each patient, getting to know them individually and figuring out what it takes to get them on the treatment:

Tim Halpin-Healy (Physics, Barnard College) spoke today at the Collective Dynamics Group on "The Dynamics of Conformity and Dissent". Unfortunately I wasn't able to attend his talk--it looked interesting--but I have to say, speaking curmudgeonly and parochially as a political scientist, that I wish physicists wouldn't use loaded words like "conformity" and "dissent" for these mathematical simplifications. (Conversely, I don't like it when social scientists refer sloppily to uncertainty principles and quantum effects in social interactions.)

I conveyed my vague sense of irritation to Peter Dodds and he replied,

i essentially agree---though on occasion a simple physics model could be said to genuinely capture some essence of whatever absurdly complicated phenomenon, such as cooperation. then it's okay, as long as the physicists involved proceed with some humility (which is of course extremely unlikely). on the other hand, insane notions of people behaving in a way the quantum mechanics might explain (or ising models, another classic) are truly riling. the wholesale transplant of a theory that makes sense for gluons to human behaviour is not good science. philip anderson's science paper of 1972 (i think it was 1972, `more is different') had the right idea i think. at every scale there are a set of locally-based rules that give rise to some collective behaviour at the next scale. and it may be that predicting the rules at the next level is extremely difficult, and they have to be taken from empirical observations.

the particular paper we're discussing on friday has some
outcomes that i thought you in particular would be interested in.
basically, the system they have evolves into two factions in most
cases and into three in relatively special cases. the big problem
i have with this model is that the mechanism doesn't make much sense.
technically, the model itself is extremely interesting and they have many excellent results but the basic set up is odd.


As I was walking down the street, a guy stuck his head out of one of those carts that sells coffee and bagels, and said to me, "Excuse me, sir." I turned around and he continued, "Tomorrow's Friday, right?" I said yes, and he continued, "Today's Thursday?" I confirmed this one too, and that seemed to satisfy him.

Social networks and voter turnout

Meredith Rolfe has a webpage with some interesting papers-in-progress on voter turnout and social networks--two important topics that are generally considered completely separately. (I guess one could say that the "research networks" of these two problem areas do not have much overlap.)

The separation of voting and social-network research bothers me. From one direction, it is traditional to study voting from a completely individualistic framework (as in much of the rational-choice literature) or else to work with extremely oversimplified "voter" models in which cellular automata go around changing each others' minds--that is not empirical political science. On the other side, social network research tends to fall short of trying to explain political behavior.

Rolfe's work is interesting in trying to connect these areas. I like her model of education and voter turnout (it's consistent, I think, with our model of rational voting).

Also, her paper on social networks and simulations was a helpful review. I'll have to interpret what's in this paper in light of our own work on estimating properties of social networks. It's a challenge to connect these network ideas to the some of the underlying political and social questions about clustering of attitudes.

Using base rate information?

Aleks points to this blog entry from "HedgeFundGuy" on bias in decision making. HedgeFundGuy passes on a report that finds that people's opinions are strongly biased by their political leanings, then he gives his take on the findings--he thinks that this so-called bias isn't really a problem, it's just evidence of reasonable Bayesian thinking.

I'll first copy out what HedgeFundGuy had to say (including his own copy of the report of the study), then give my take, which is slightly different than his.

Spatial statistics and voting

In political science, "spatial models" are usually metaphorical, with the "spatial" dimensions representing political ideology (left to right) or positions on issues such as war/peace or racial tolerance. But what about actual spatial dimensions, actual distances on the ground? In some sense, spatial models are used all the time in analyzing political data, since states, counties, Congressional districts, neighborhoods, and so forth are always (or nearly always) spatially contiguous. Along with these political structures, one can also add spatial information in the form of distances between units and then fit so-called geostatistical models.

Drew Thomas has done some work along these lines, fitting spatial-statistical modeling to vote data from the counties in Iowa. (See also a draft of his paper here). Much more could be done here, clearly, but this work might be of interest as a starting point for others who want to play with these sorts of models.

The death penalty . . . for forgery?

I was reading a fascinating review by Ian Gilmour in the London Review of Books of a book called "The Reading Nation in the Romantic Period", by William St. Clair. (I'm a sucker for books about what people read, or used to read. I recently read and enjoyed "A Sinking Island: The Modern English Writers", by Hugh Kenner. And this St. Clair book looks even more interesting because it is apparently full of statistical data.

Anyway, in his review, Gilmour has a little aside about William Dodd, eighteenth-century printer of Shakespeare who was hanged for forgery. Really?? I guess I realized that they used to hang people for minor offenses, but still! The authorities must really have felt that the social order was pretty fragile, or life was cheap, or something. Couldn't they have just flogged him or something?

Thoughts on Eric Johnson's talk

Eric Johnson (a psychologist at the Columbia Business School) spoke today at the Decision Sciences seminar.

A fascinating talk

His topic was "decisions as memory" (maybe i'm getting the exact words wrong here), and the key idea was that, in the process of making a decision, a person queries his or her memory, thinking of good and bad aspects of different decision options. There's lots of research on memory that covers all sorts of artifacts (for example, when you remember one item, you will be led to similar items). The idea of this research program is that, if memory is a key part of judgment and decision making, then many of the weird (or at least, non-normative) aspects of decision making--which have been studied by Kahneman, Tversky, and others over the years--can maybe be explained at a more cognitively basic level as quirks of how we remember things and how we access these memories.

My comments/questions

I had a bunch of comments on the talk (which will probably be incomprehensible unless you were there, but it's helpful for me to put them down):

A few years ago I was checking an article that was about to be published in a statistics journal and I noticed that the copy editor had made a bunch of stupid changes that I then had to go back and fix. Actually, this has also happened for my two books.

This is a funny thing. A copy editor is a professional editor. All they do (or, at least, much of what they do) is edit, so how is it that they do such a bad job compared to a statistician, for whom writing is only a small part of the job description?

The answer certainly isn't that I'm so wonderful. Non-copy-editor colleagues can go through anything I write and find lots of typos, grammatical errors, confusing passages, and flat-out mistakes. (And check out the long list of errata for the first printing of our book!)

No, the problem comes with the copy editor, and I think it's an example of the pinch-hitter syndrome. The pinch-hitter is the guy who sits on the bench and then comes up to bat, often in a key moment of a close game. When I was a kid, I always thought that pinch hitters must be the best sluggers in baseball, because all they do (well, almost all) is hit. But of course this isn't the case--the best hitters play outfield, or first base, or third base, or whatever. If the pinch hitter were really good, he'd be a starter. So, Kirk Gibson in the 1988 World Series notwithstanding (I was watching that on TV--that gives me credit for being there, right?), pinch hitters are generally not the best hitters.

There must be some general social-science principle here, about generalists and specialists, roles in an organization, etc?

People are always asking me if I want to use a fixed or random effects model for this or that. I always reply that these terms have no agreed-upon definition. People with their own favorite definition of "fixed and random effects" don't always realize that other definitions are out there. Worse, people conflate different definitions.

Five definitions

Here are the five definitions I've seen:

Jim Hammitt (director of the Harvard Center for Risk Analysis) had a question/comment about my paper, Estimating the probability of events that have never occurred: when is your vote decisive? (written with Gary King and John Boscardin, published in the Journal of the American Statistical Association).

The paper focused on the problem of estimating the probability that your single vote could be decisive in a Presidential election. There have been only 50-some elections, and so this probability can't simply be estimated empirically. But, on the other side, political scientists and economists had a history of estimating this sort of probability purely theoretically, using models such as the binomial distribution. These theoretical models didn't give sensible answers either.

In our paper we recommended a hybrid approach, using a theoretical model to structure the problem but using empirical data to estimate some of the key components. We suggest that this is potentially a general approach: estimate the probability of very rare events by empirically estimating the probability of more common "precursor" events, then using a model to go from the probability of the precursor to the probability of the event in question.

But Jim is skeptical. He writes:

Rick Perlstein in the Village Voice writes that the No Child Left Behind law sets unrealistic targets:

The (John) Smiths

In reading Stefan Collini's review of the (British) Dictionary of National Biography in the London Review of Books, I learned that the dictionary contains entries on 63 John Smiths. That's only 1 tenth of one percent of the entries, but 63 still seems like a lot.

Brouhaha about multilevel models

Are multilevel (hierarchical) models the coolest thing in the world or just a fancy way to fool yourself? Jan de Leeuw (statistics, UCLA) thinks both!

Blog about statistics teaching

My Columbia colleague Tian Zheng has started a blog focusing on her struggles and successes teaching introductory statistics. There's certainly a lot that can be said on this topic.

I'd appreciate any links to weblogs or other resources on teaching statistics. We're already linking to the Chance page at Dartmouth (more of a newsletter than a blog, but the same idea) and Chris Genovese's page at Carnegie Mellon. The Chance page includes a bunch of links to statistics teaching resources but it doesn't seem to have been updated in awhile and a lot of its links don't work.

Neurobiology and decision making

David Laibson, Samuel M. McClure, George Loewenstein, and Jonathan D. Cohen will be speaking this Thurs, 20 Jan, 2:30-4pm, at 404 IAB, on "Neuroeconomics and Impulsivity." Their article is available here.

Their studies suggest that short-term and long-term rewards activate different areas of the brain. Personally, I think economists worry too much about intertemporal choice as a factor in decision making. I've been convinced by Dave Krantz that the idea of time discounting (for example, that an item now is equivalent in utility to 1.05 items to be delivered in a year) is not as universally applicable to decision analysis as seems generally assumed. I'll get into this more another time.

In any case, the article looks interesting and I expect the talk will be interesting also.

Data-driven Vague Prior Distributions

I'm not one to go around having philosophical arguments about whether the parameters in statistical models are fixed constants or random variables. I tend to do Bayesian rather than frequentist analyses for practical reasons: It's often much easier to fit complicated models using Bayesian methods than using frequentist methods. This was the case with a model I recently used as part of an analysis for a clinical trial. The details aren't really important, but basically I was fitting a hierarchcal, nonlinear regression model that would be used to impute missing blood measurements for people who dropped out of the trial. Because the analysis was for an FDA submission, it might have been preferable to do a frequentist analysis; however, this was one of those cases where fitting the model was much easier to do Bayesianly. The compromise was to fit a Bayesian model with a vague prior distribution.

Sounded easy enough, until I noticed that making small changes in the parameters of what I thought (read: hoped) was a vague prior distribution resulted in substantial changes in the resulting posterior distribution. When using proper prior distributions (which there are all kinds of good reasons to do), even if the prior variance is really large there's a chance that the prior density is decreasing exponentially in a region of high likelihood, resulting in parameter estimates based more on the prior distribution than on the data. Our attempt to fix this potential problem (it's not necessarily a problem if you really believe your prior distribution, but sometimes you don't) is to perform preliminary analyses to estimate where the mass of the likelihood is. A vague prior distribution is then one that is centered near the likelihood with much larger spread.

A well-publicized example of problems with observational studies is hormone replacement therapy and heart attack risks for postmenopausal women. In brief, the observational study gave misleading answers because the "treatment" and "control" groups differed systematically. Could the method of propensity scores have found (and solved) the problem?

CrashStat

Accident statistics are a standard example for teaching count data. Some fascinating collections of data on pedestrian and bicycle accident data in New York City are available at www.crashstat.org. These include detailed maps (all intersections in New York City) as well as breakdowns by zip code. Lots of count data!

Twins

Curious about the latest statistics on twins (I had heard that they are more frequent in the context of modern fertility treatments), I did a quick google.

The Monthly Labor Review (a journal published by the Bureau of Labor Statistics) has an online version that features a column called Precis, which summarizes a few research abstracts each month. The subject matter is always economics but also just about always of general interest.

For example, some recent topics: The business cycle and earnings and income inequality; Siblings and earnings inequality; Time stress and its causes; Self-employment around the world; ...

The current (December 2004) issue of Precis is here and the links to all of them (since 1998) are here. This is a great public service and perhaps could be successfully imitated by other agencies.

  1 2 3 4 5 6 7 8 9 10 11 12 13 14 15 16 17 18 19 20 21 22 23 24 25 26 27 28 29 30 31 32 33 34 35 36 37 38 39 40 41 42 43 44 45 46 47 48