I get a lot of questions of the form,"I've fit a multilevel model. How can I summarize/understand it?"
My response: see Sections 12.4, 13.1, and 21.1 of our book. The key concepts are uncertainty and variability.
I get a lot of questions of the form,"I've fit a multilevel model. How can I summarize/understand it?"
My response: see Sections 12.4, 13.1, and 21.1 of our book. The key concepts are uncertainty and variability.
Anna Kirkland is speaking at the Gender and Politics colloquium series on Ideologies of the Fat Rights Movement. The talk is called Think of the Hippopotamus: Fat Women and the Law of the Land. Here's the paper, and here's the abstract:
This study of fat acceptance group members asks how stigmatized people who are excluded from legal protections muster descriptions of themselves as deserving coverage in antidiscrimination laws. Analysis of in-depth interviews with fat acceptance advocates from around the United States reveals elaborate and non-legal daily coping strategies that co-exist with much more narrowly framed arguments for rights. The kinds of reasons that count in establishing that a fat person should not be discriminated against augment the ideology of functional individualism, an account of personhood with reach far beyond this context. This way of reasoning about what persons deserve frames and pre-determines what is possible to say in defense of fat people, in many ways even for fat advocates themselves.
I like this sort of qualitative study. It should be interesting (even if no graphs). From page 27:
Echoing the “like race” strategy for adding new groups to antidiscrimination laws (Skrentny 2002), many interviewees talked about how fatness was or was not like being black or being gay. (“Black” and “gay” were invoked most commonly by far; other identity traits received almost no mention.) Acceptance group members grappled through analogies with what most understood to be the foundational justice question: are people fat by choice? Is it more like being black or more like smoking?
It's interesting to think of these sorts of categorization, also interesting that it seems more OK to discriminate if it's a chosen behavior. I've sometimes thought that many drivers treat bicyclists like gay people, in that the drivers appear to feel threatened by this alternative lifestyle. It's also been much discussed how people in the majority group often seem to feel the need to hassle people of minority religious groups (with a notable example in the U.S. being Mormons) or miniority tastes (e.g., vegetarians). Religion is an example because it's sort of a choice and sort of already determined.
The talk will be Thurs 5 Apr at 4:10pm in the Playroom.
Just came in the inbox:
Daniel Gingerich will be speaking at the Political Economy seminar next Tues on this paper. Here's the abstract:
What is the relationship between electoral rules and the level of political corruption found in a polity? A rich body of theory in comparative politics suggests that electoral systems which encourage intraparty competition and candidate-centric elections tend to produce costly campaigns and generate high demand among politicians for electoral resources. For this reason, such electoral systems are widely thought to be responsible for high levels of corruption related to the financing of politics. Yet the Latin American experience makes evident that political corruption can also flourish under electoral systems which proscribe intraparty competition, in some cases reaching levels which far surpass those of their candidate-centric counterparts.
Michael Kubovy writes,
Can you point me to a model report of empirical research (preferably of a designed experiment) using mixed models?As you know, the pattern in psychology is to have a stultifying paragraph listing which effects and interactions were or were not significant: "… the a by b interaction was significant --- F(n1, n2) = 23.3456, p ≤ .00023 … " --- followed by an interaction plot that summarizes the main results.
My policy as an associate editor:
1. Review the article immediately: read and review simultaneously, don't read first and review later.
2. Review it myself; don't send to referees. If I don't think I'm capable of reviewing the article, just sent to someone else to do it.
My policy as a reviewer:
1. Item 1 above.
2. Don't worry that good papers get rejected or bad papers get accepted. That happens, and worrying about it is not my job.
3. Insert this paragraph.
4. Be polite.
These (not statistically-validated) thoughts were stimulated by reading this article in the most recent issue of Public Library of Science - Medicine:
Ben Jann writes,
I came across your paper on the difference between significant and non-significant results. My experience is that this misinterpretation is made in about every second talk I hear and also appears in a lot of published work.Let me point you to an example in a prominent sociological journal. The references are:
Wu, Xiaogang and Yu Xie. 2003. "Does the Market Pay Off? Earnings Returns to Education in Urban China." American Sociological Review 68:425-42.
and the comment
Jann, Ben. 2005. "Earnings Returns to Education in Urban China: A Note on Testing Difference among Groups." American Sociological Review 70:860-864.
I received a manuscript copy of Naseem Taleb's The Black Swan the other day. (See here for my comments on Taleb's previous book.) As with the earlier book, The Black Swan covers topics with which I am already familiar, so the act of reading it (with pen in hand) jogged a bunch of my own thoughts out in the open. So that's mostly what I'll talk about here.
Or that's what I would talk about, except that I took the manuscript with me downtown today, made comments on the first 40 pages or so, then put it in one of the bags on my bike and went to the store, head full of thoughts. When I got to the store to write down my ideas, I saw nothing in my bike bags but blackbody radiation (the physics majors among you will know what I'm talking about here), meaning that the manuscript, my comments, and my shopping list were gone. Maybe that bus that had honked at me 15 blocks back was telling me something was flying off my bike, maybe I shouldn't have flipped him off. Or that's what I would've thought, except that when I was putting the groceries on my my bike, I noticed the manuscript was there all along! I'd forgotten that nothing useful escapes from a blackbody--you have to shine a light in or feel around a bit.
So I actually do have a lot of comments, but I'll save most of them until I've finished the book.
Someone sent me the following email:
Dear Prof. Gelman,I should be very glad to receive the paper:
Effects of storage temperature and preservative treatment on shelf life of the pond-raised freshwater fish, silver perch (Bidyanus bidyanus).
J Food Prot. 2001 Oct;64(10):1584-91. Links
Effect of ozone pretreatment on fish storage life at low temperatures.
J Food Prot. 2005 Apr;68(4):778-84.
I received the following email:
My major pet peeve are rankings on various web sites. This picture of restaurant rankings should clarify the problem:

Shouldn't the 4-review 5-star ranking be above the 1-review 5-star ranking? Four excellent reviews should increase our confidence in the quality more than a single review.
The mistake lies in using the frequentist mean instead of a Bayesian posterior mean for aggregating the reviews, which disregards the number of reviews. The Bayesian prior would inform us that all rankings tend to be centered at, say, 3. The reviews would then be able to push the estimate away from 3.
How to implement this? We can assume that the prior for rankings of restaurants is N(3,1) - a Normal distribution with the mean 3 and the variance of 1. Let us also assume that the rankings for a particular restaurant have a standard deviation of 1: under this assumption our prior is conjugate. Second, we have the average y of the n rankings. The posterior mean (see page 49 of the second edition of the BDA book) will then take the following form:
μn = [ 3 + ny ] / [ 1 + n ]
If we take the averages and the counts from the table above, compute μn and sort by it, we get the following table:
| μn | y | n |
|---|---|---|
| 4.6 | 5.0 | 4 |
| 4.5 | 5.0 | 3 |
| 4.3 | 4.5 | 9 |
| 4.3 | 4.5 | 5 |
| 4.1 | 4.5 | 3 |
| 4.0 | 5.0 | 1 |
| 4.0 | 5.0 | 1 |
| 4.0 | 5.0 | 1 |
| 4.0 | 4.5 | 2 |
In Snow White it was the magical mirror that answered the question "who's the fairest of them all?" Now Australian researchers have created software to answer this question. They extracted 13 features and used C4.5 as classification method (more features below). (Detail can be found in: Assessing facial beauty through proportion analysis by image processing and supervised learning)

With that in hand, it may be natural to wonder who's the most beautiful of them all? Shocking answer may be found in the research done at the universities of Regensburg and Rostock in Germany, where they did a large research project on 'facial attractiveness'.
A remarkable result of our research project is that faces which have been rated as highly attractive do not exist in reality. This became particularly obvious when test subjects (independently of their sex!) favored women with facial shapes of about 14 year old girls. There is no such woman existing in reality! They are artificial products - results of modern computer technology.Thus, sad as it may be, your ideal beauty may not be in this world. So going back to the good old Snow White, if the magical mirror were asked the question today, it may answer; "You're the fairest where you are, but in the virtual world, well let's not go into that.."
We once collected the following data from a certain chemical process:

The curve looks smooth and could be governed by some meaningful physical law. However, what would be a good model? There is probably quite a number of physical laws that would fit the observed data very well. Wouldn't it be nice if a piece of software would examine a large number of known physical laws and check them on this data? ZunZun.com is such a piece of software, and it runs directly from the browser. After plugging my data in, ZunZun gave me a ranked list of functions that fit it, and the best ranked was the "Gaussian peak with offset" (y = a * e(-0.5 * (x-b)^2 / c^2) + d):

Number two was "Sigmoid with offset" (y = a / (1.0 + e(-(x-b)/c)) + d).
In all, ZunZun may help you find a good nonlinear model when all you have is data.
I read this entry on study of correlation between music and personality .
A series of 6 studies investigated lay beliefs about music, the structure underlying music preferences, and the links between music preferences and personality. The data indicated that people consider music an important aspect of their lives and listening to music an activity they engaged in frequently. Using multiple samples, methods, and geographic regions, analyses of the music preferences of over 3,500 individuals converged to reveal 4 music-preference dimensions: Reflective and Complex, Intense and Rebellious, Upbeat and Conventional, and Energetic and Rhythmic. Preferences for these music dimensions were related to a wide array of personality dimensions (e.g., Openness), self-views (e.g., political orientation), and cognitive abilities (e.g., verbal IQ).

Parsefork is an aggregator of music reviews - which reminds me of Metacritic. In plain words, it collects reviews of music from different sources and presents it as a easily navigable and searchable web database. The main shift in the past few years is the abundance of specialized structured databases that are available on the internet. Back in the 90's most of the internet "databases" were based on text.
This data would be a great setting for multi-level modeling, as each review refers to an artist, an album, a piece, a magazine and a reviewer. There are quite a few things that multi-level modeling could do for such websites. Here is an example of the reviews for a single song, Happy Songs for Happy People:

A friend of mine introduced this site to me. It's a database for information graphics that Parsons Institute for Information Mapping (PIIM) is building. They are accepting submissions so if you have interesting graphical display, take a shot to be in the "most comprehensive, manually annotated (and taxonomically classified) information graphics database in the world" which they are aiming for. I was not able to pull out 1200 graphics, but there are displays that I've never seen before. A list of key words might be helpful.
Most academic research employs basic variables that are then correlated or regressed on with outcomes of interest. These basic variables are, for example, income, state and similar. Using such variables we can claim that, on average, urban dwellers vote for Democrats and that rural dwellers vote for Republicans. Moreover, we can claim that the rich tend to vote for Republicans and the poor for Democrats. We also know that urban dwellers on average make more money than rural dwellers. To resolve the dilemma is to form a categorical variable that combines the information from both area and income, thus avoiding the need to tackle the interaction.
While one could conceive ad hoc variables such as urban poor/rich, rural poor/rich, a better answer is in making use of segmentations developed primarily for marketing purposes. Here is a visualization of the Mosaic demographic groups and types:

The groups are: A - symbols of success, B - happy families, C - suburban comfort, D - ties of community, E - urban intelligence, F - welfare borderline, G - municipal dependency, H - blue collar enterprise, I - twilight subsistence, J - grey perspectives, K - rural isolation. The types with much detail can be found in MS Word document - sociologists, do take a look. Another interesting segmentation is
PRIZM, which is also linked to ZIP codes in the US.
Josiah Charles Stamp, 1st Baron Stamp, Bt, GCB, GBE, FBA, (June 21, 1880-April 16, 1941) was a British civil servant, industrialist, economist, statistician and banker. He was the first director of the Bank of England and chairman of the London Midland and Scottish Railway.
Statistics
"The government are very keen on amassing statistics. They collect them, add them, raise them to the nth power, take the cube root and prepare wonderful diagrams. But you must never forget that every one of these figures comes in the first instance from the village watchman, who just puts down what he damn pleases." (quoting an anonymous English judge.)
The individual source of the statistics may easily be the weakest link.
Banking
"Banking was conceived in iniquity and was born in sin. The bankers own the earth. Take it away from them, but leave them the power to create money, and with the flick of the pen they will create enough deposits to buy it back again. However, take it away from them, and all the great fortunes like mine will disappear and they ought to disappear, for this would be a happier and better world to live in. But, if you wish to remain the slaves of bankers and pay the cost of your own slavery, let them continue to create money."
via devinmoore
Two weeks ago there was a press conference with James Cameron (the creator of Titanic, the highest-grossing, most-nominated and receiving most Oscars of all movies to date). Those credentials tend to be taken seriously when a documentary claims they discovered the tomb of Jesus. The documentary was a serious success - James Tabor (one of the advisors) reports 4.1 million viewers.
One of the key pieces of evidence was a statistical calculation that those names must have belonged to Jesus' family - you can read more about it from the source, Andrey Feuerverger. A quantitative investigation into those claims has appeared in Scientific American (with some of my involvement) and later in the Wall Street Journal column and blog. These articles stress the importance assumptions behind the calculations. But there is more interesting detail to what is going on.
First, there is a lot of confusion about "those names are frequent". Of course, Feuerverger did take that into consideration. The real problem is in the interaction between the names on the coffins and the contents of the coffins, which is a simple example of a probability calculus. Let me thus walk through the calculations [PDF].
It's not a problem to think that Jesus had a tomb: indeed, he was said to be buried. The authors assumed the probability to be 1/1,000 - meaning that one of the tombs was surely Jesus Christ's. This is fine, we denote it as P(Tomb=Jesus)=1/1,000. Easily, P(Tomb=Random)=999/1,000. It is also not a problem to assume the probability of that particular choice of names out of all possible ones to be 1/600,000. We denote it as P(Names|Tomb=Random) = 1/600,000
P(Names|Tomb=Jesus)=1.0 is a major can of worms - we need this assumption to compute the probability P(Tomb=Random|Names). Why? The probability is computed through the Bayes rule:
P(Tomb=Random|Names) = P(Names|Tomb=Random) P(Tomb=Random) / (P(Names|Tomb=Random) P(Tomb=Random) + P(Names|Tomb=Jesus) P(Tomb=Jesus))
Here P(Names|Tomb=Jesus) = 1, P(Tomb=Jesus) = 1/1,000, P(Names|Tomb=Random) = 1/600,000, P(Tomb=Random) = 999/1,000. P(Tomb=Random|Names) corresponds to odds of about 1 in 600, but only if you agree with the other numbers.
First, to assume that the bones inside the "Jesus" ossuary are Jesus Christ's would be inconsistent with the hard-line interpretation of the Ascension - that Jesus Christ physically ascended to heaven, so his bones aren't there - they would want this probability to be zero based on the properties of the tomb. Note that not all Christians believe in physical Ascension, but those who do would assign the probability of Jesus having a full ossuary to 0 (but I don't know if the ossuary was full or not, I'm assuming it was full). Secondly, hard-line Christians are quite ignited over the implication that Jesus would have a wife and a child, as is the case with this particular tomb. Instead, they would claim that the probability is zero, because the idea of a married Jesus with a wife and a child would be contrary to their understanding of the Bible.
Feuerverger went beyond what I would have gone, so my guess in Scientific American was wrong. The probability of 1/600,000 is reasonable and safe: it's the probability that a random tomb would carry those names. The number of 1,000 is also safe: it's the number of tombs. But using the Bayes rule to come up with the probability that the tomb is a random find is no longer safe. Why? Because it is based on P(Names|Tomb=Jesus) - you're opening a Pandora's box of trouble.
As for other lessons learned, when you talk with a journalist, don't explain things that *he* would understand it, explain it so that *everyone* would understand, because you're going to be quoted and you don't want to sound as eggheaded as I have. Also, try to keep the answer within a sentence or two. In the past I've had the chance to edit the final version, but you can't count on it.
My inbox reached 200! This was too much so I spent several days cleaning it out. Now it's at 0 (for an instant). Here's the documentary evidence:
Delia writes,
The paper I was talking about with respect to the accuracy in reporting social attributes of friends is:Laumann EO. 1969. Friends of Urban Men: An Assesment of Accuracy in Reporting Their Socioeconomic Attributes, Mutual Choice, and Attitude Agreement. Sociometry 32: 54-69
In general, they found that errors in reporting are less frequent for relatively objective characteristics (age, occupation) than for the less visible and public characteristics of the friend (political attitudes). Where errors occur, they are in the direction of the respondent ascribing his own characteristics to his friend. With respect to party ID they found that Democratic respondents tend to project their own political attitudes onto their friends. Republicans are a bit more accurate, however they tend to overestimate the number of Democrats! Data: subsample of the Detroit Area Study 1966.
I am pretty sure there is something more recent (80s), probably by Huckfeldt and Sprague (1995 etc). If anybody is interested, I'll be able to be more precise on this soon since its part of my dissertation.
The other interesting piece is a book chapter by
Gimpel JG, Lay, J. Celeste. 2005. Party Identification, Local Partisan Contexts, and the Acquisition of Participatory Attitudes. in The Social Logic of Politics. Personal Networks as Contexts for Political Behavior, ed. AS Zuckerman: Temple University Press
They use multilevel models to examine the 'effect' of party dominance at the local level (community level variables, like % Democrats, turnout and partisan diversity) on political socialization (pol discussion and knowledge, internal and external pol efficacy). They found that the more acute one's political minority status, the worse political socialization outcomes will be. Being part of a perpetual minority is demoralizing. Minority status perpetuates itself over time by discouraging the participation of minor-party partisans.
This is pretty cool stuff, in that perceptions of political polarization can be as important as polarization itself.
When I spoke at Yale, Brian Knight told me about his paper with Kate Antinovics on racial profiling of police officers. Here's the abstract:
This paper provides new evidence on the role of preference-based versus statistical discrimination in racial profiling using a unique data set that includes the race of both the motorist and the officer. We build upon the model presented in Knowles, Persico and Todd (2001) and develop a new test for distinguishing between preference-based and statistical discrimination. In particular, we show that if statistical discrimination alone explains differences in the rate at which the vehicles of drivers of different races are searched, then, all else equal, search decisions should be independent of officer race. We then test this prediction using data from the Boston Police Department. Consistent with preference-based discrimination, our baseline results demonstrate that officers are more likely to conduct a search if the race of the officer differs from the race of the driver. We then investigate and rule out two alternative explanations for our findings: officers are better at searching members of their own racial group and the non-random assignment of officers to neighborhoods.
This is a topic of research interest to me (in collaboration with Jeff Fagan), and it was interesting to see the progress that Antonovics and Knight made by including more data. I don't really have anything more to say (beyond the predictable comment about the tables).
Simon Frost sent this in:
Insipred by the coin-flipping discussion, a correspondent writes,
Are you familiar with the iPod "Shuffle" controversy of perhaps a year and a half or two years ago? If not, I'll offer briefly, as you might enjoy, or find useful for class: when the iPod Shuffle came out, and was said to be an entirely random playing of one's iPod songlist, hundreds and soon thousands of users complained or simply commented on how it absolutely was NOT random. The wrote passionately on the web of how they would hear song X 5 times in a day, and not hear song Y for a week.Apple would not give out the algorithms for mathematicians to check. But that didn't stop math students, grad students and professors from weighing in. The results, as I understand them, said that the "Shuffle" was as random can be, but that randomness does not appear random (your point, on the radio), and with music this is complicated because we respond to our favorite songs differently than others. So our brains create patterns of order which are really...random. Naturally, most people who believed their iPod Shuffles (or the Shuffle function on their other iPods) to be non-random found this a bunch of hooey. But then the root of "belief" is Old English and German, coming from "dear" and "love". So we believe what we hold dear, what we love; and we come to love what we believe. And of course it's hard to change minds in love.... Which brings us to your other discipline, political science.
I hadn't heard about that Ipod thing--it does seem like a good example for teaching probability.
Georgia writes,
Here's an interesting classification (from John Langford) of statistical methods from a machine learning perspective. The only thing that bothers me is the conflation of statistical principles with computational methods. For example, the table lists "Bayesian learning," "graphical/generative models," and "gradient descent" (among others) as separate methods. But gradient descent is an optimization algorithm, while Bayesian decision analysis is an approach that tells you what to optimize (given assumptions). And I don't see how he can distiguish graphical/generative models from "pure Bayesian systems." Bayesian models are almost always generative, no? This must be a language difference in CS versus statistics.
Anyway, it's an interesting set of comparisons. And, as Aleks points out, we're trying our best to reduce the difficulties of the Bayesian approach (in particular, the difficulty of setting up models that are structured enough to learn from the data but weak enough to learn from the data).
Ebonya pointed me to this paper by Jacob Vigdor which addresses a similar question to that of Huber and Stanig's paper, "Why do the poor support right-wing parties?". A natural answer to this sort of question is that people have economic ideologies--basically, you can support conservative economic policies if you believe they are good for the economy, or for moral reasons (for example, feeling that the flat tax is fairest). Huber and Stanig's paper was interesting partly because it addressed variation among countries in these voting patterns.
Anyway, Vigdor has a slightly different perspective. Here's his abstract:
Aleks sent along this announcement:
Serguei Kaniovski sent me this paper. Here's the abstract:
I [Kaniovski] discuss a numerical scheme for computing the Banzhaf swing probability when votes are not equiprobable and independent. Examples indicate a substantial bias in the Banzhaf measure of voting power if either assumption is not met. The analytical part derives the exact magnitude of the bias due to the common probability of an affirmative vote deviating from one half and due to common correlation in unweighted simple-majority games. The former bias is polynomial, whereas the latter is linear. I derive a modified square-root rule for two-tier voting systems which takes into account both the homogeneity and the size of constituencies. The numerical scheme can be used to calibrate an accurate empirical model of a heterogeneous voting body, or to estimate such a model from ballot data.
The model in the paper is related to my paper with Tuerlinckx and my paper with Katz and Bafumi. It has a slightly different from our work in focusing on settings with small numbers of voters (e.g., 2, 3, or 4), whereas we are interested in elections with thousands or millions of voters. That stated, I completely disagree with the focus on the square-root rule (section 4.1 of the paper), since the underlying assumption here--that elections with large numbers of voters will be much closer (in vote proportion) than elections with small numbers of voters--does not occur in reality; see here for a discussion in the U.S. context. (Kaniovski notes this in a footnote on page 20 of his paper, but I don't think he's fully internalized our results--if he had, I don't think he'd focus on the square root rule.) The mathematics of the paper seem reasonable so it might point to a useful future direction of this research.
Finally, I like the last paragraph of the paper:
The main conclusion of this paper is that, despite the Banzhaf measure being a valid measure of a priori voting power and thus useful for evaluating the rules at the constitutional stage of a voting body, it is a poor measure of the actual probability of being decisive at any time past that stage. The Banzhaf measure cannot be used to forecast how frequent a voter will be decisive.
Except that, given that the Banzhaf measure is a poor measure etc., I don't see why it is appropriate to claim that it is "useful for evaluating the rules at the constitutional stage." If it's wrong in all the empirical examples, I don't see how it can be useful at the constitutional stage. I mean, if you lose on red and you lose on black, and you lose on 0 and you lose on 00, then you don't need to actually spin the wheel to know you're in trouble!
Whenever I teach an intro class, I say to my students, "Remember that movie with the teacher from L.A. who has all those students who think they can't learn math, then he teaches them how to do it?" They respond, yeah. "Well," I continue, "as you probably know, Columbia scours the country looking for these top teachers, then hires them. [pause] Not." Actually, I tell them, "Columbia scours the country looking for the best students--that's you--and then finds the world's best researchers--that's us. We can teach you stuff because we know everything. But we're not such good teachers, so you have to use your student skills to learn. My goal as a teacher is to teach you how to teach yourself statistics." Etc. etc.
Anyway, Kipp Herreid, the Director of the National Center for Case Study Teaching in Science, writes,
We often like to say 50:50 when in doubt. Why this tendency? There are two different ways of arriving to such a conclusion: worst-case analysis and Bayesian inference.
1. A worst-case decision theorist (often also found in machine learning, statistical learning or computational learning circles) would assume some sort of a loss function L(pprediction,ptruth). Examples of loss functions would be Brier score (similar to L2), or Kullback-Leibler divergence. We would then try to find a value for pprediction that is least far to any ptruth. Essentially, we try to bound the loss.
2. A Bayesian would assume a uniform (or at least symmetric) prior on the truth P(ptruth). With no data, the posterior is the same as prior. We then try to summarize the prior with the expected value for ptruth: the expected value is essentially the 'center', a single value that replaces the variety of possibilities.
It happens that both of these approaches result in the same 50:50. But the derivations are very different. As Bayesians we summarize, as decision theorists we optimize. As Bayesians we assume the probabilities for various events, but remain agnostic about the loss: decision theory is easy once you have true probabilities. As decision theorists we assume the costs, but remain agnostic about the truth: we start as a blank slate.
Kai Ruggeri writes,
I am doing my PhD research on teaching strategies for statistics and have been reading through your book. Regarding your first day/week activities, I was just wondering if there were any empirical studies done to demonstrate the productivity and/or benefit of these exercises. I have had a great deal of trouble in searching for certain empirical data.
My reply:
Seth Roberts did some self-experimentation several years ago and found that watching faces on TV in the morning improved his mood (see here for a link to his article on this research along with some of my thoughts). Several years ago, I email-interviewed Seth on this. The interview never appeared anywhere and we just dug it up, so I'm posting it here. (Seth will also post it on his blog, which has many of his thoughts on self-experimentation.)
Andrew Gelman: Why don't you start by describing your method of using TV watching to cure depression?
Seth Roberts: To feel better, you watch faces on TV in the morning and avoid faces (televised and real) at night. TV faces are beneficial in the morning and harmful at night only if they resemble what you would see during an ordinary conversation. The TV faces must be looking at the camera (both eyes visible) and close to life-size. (My experiments usually use a 27-inch TV.) Your eyes should be about three feet from the screen. Time of day is critical--if you see the TV faces too early or late they will have no effect. The crucial time of day depends on when you are exposed to sunlight but figuring out the best time of day is mainly trial and error right now. I usually have subjects start watching around 7 a.m. They watch about 50 minutes of faces each morning, and so do I.
Most mornings I watch little snippets of TV shows with plenty of faces looking at the camera, such as The News Hour with Jim Lehrer (PBS), the Talking Points section of The O'Reilly Factor (Fox News), Washington Journal (C-SPAN), and Larry King Live (CNN), that I taped the day before. I usually fast-forward through the non-big-face portions. The best TV show for this research is Booknotes (C-SPAN), on Sunday, which I watch in pieces throughout the week. My subjects watch tapes of Booknotes.
AG: How did you come up with this idea?
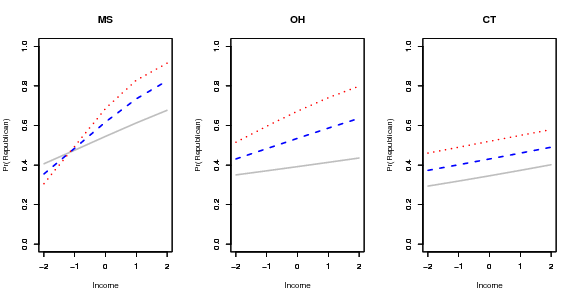
John Huber and Piero Stanig will be speaking on this paper tomorrow in the comparative politics seminar. This is important stuff. From the paper:
Why do poor people, who would benefit from redistribution, often vote for parties that oppose it? Democratic elections can serve to diminish inequality by enabling a country’s poorest members to receive resources from wealthier ones. The poor can obtain these resources by helping to elect parties that pledge to tax the rich and transfer the proceeds to the poor. But if the poor do tenot vote for parties that are committed to redistribution, elections are unlikely to play this role of raising the economic well-being of the poor. Why, then, would some poor individuals use their vote to advance the electoral success of right-wing parties that oppose redistribution?
Both income and religious attendance are predictive of voting for conservative parties (in the context of this paper, parties that oppose redistributive policies):
The average proportion of right-wing support increases as income increases, regardless of whether we include all voters or classify voters by religiosity. And the average proportion of right-wing support is higher among religious than among secular voters, regardless of whether we include all voters or classify by income. . . . But one interesting interaction emerges from these summaries of aggregate proportions. When we consider income polarization between the middle class and the poor, it is higher among religious than secular voters.
This is consistent with what we found in the U.S.:
When looking at voting and state income (red states and blue states, etc.), we realized that, although many of the geographic patterns of voting in the U.S. are relatively recent (for example, New England used to be strongly Republican, now is solidly Democratic), the rankings of states as rich and poor has been steady for quite awhile. The rich states now are, by and large, the states that had factories and large cities 50 or 100 years ago. Here are some graphs (using Census data that Justin Phillips gave me):

Apparently this isn't just a U.S. phenomenon. Diego Comin, WIlliam Easterly, and Erick Gong find that the wealth of nations was determined in 1000 B.C. Their paper is interesting and has some cool maps, but the graphical presentation could be improved a bit. I'll offer some suggestions on the chance that they'll have an opportunity to revise:
John Langford writes (in an entry linked to for other reasons by Aleks),
How many papers do you remember from 2006? 2005? 2002? 1997? 1987? 1967? One way to judge this would be to look at the citations of the papers you write—how many came from which year? For myself [Langford], the answers on recent papers are:year 2006 2005 2002 1997 1987 1967count 4 10 5 1 0 0
This spectrum is fairly typical of papers in general. There are many reasons that citations are focused on recent papers. . . .
Another way to study this is to look at the dates of Langford's own most-cited papers. Doing a Google Scholar on "John Langford" yields papers from 2000, 2003, 1999, 2004, 2001, 2002, 2003, 2002, 2002, 1998, . . . Slightly earlier than the years of the papers he cites the most, but this makes sense if you think of time-censoring (older papers have had more years in which to be cited).
Comparing computer science to statistics
Anyway, I was surprised that Langford was citing such recent papers. Just to look at some of my own recent papers, about half the papers I'm citing come from before 2000. Similarly, my own most cited papers are from 1992, 1996, 1998, 1993, 1996, 1998, 1998, 1990, . . .
This is just a sample of size 2, but based on this, let me conjecture that CS is a particularly new field, and thus the pattern John saw may be particularly strong in his field.
Tyler Cowen reports that the American Economic Association is introducing four new journals, which presumably will instantly be "top-tier." Cowen writes, "Overall I consider this bad news. It expands the career-making power of one professional association and the editors it nominates. It further encourages overspecialization, and discourages general interest research. . . ."
My first impression is the opposite.
Shravan asks,
Suppose I do a multilevel model analysis of repeated measures reaction time data and some predictor that I have for reaction time shows a significant HPD interval/p-value. But when I look at the estimate I find that the effect is about 1 millisecond. This means in effect that that particular effect only contributes a one ms slowdown to reaction time. But it's significant statistically; sometimes it is hugely significant.If one is just looking for whether the effect has an impact on reaction time, not the magnitude of the effect, should one declare evidence in favor of the effect? Or should one say, well, it *is* statistically significant, but what does a slowdown of 1 ms mean? Our hardware only samples events only 4 ms. Under this second view, I would be forced to say that in practice this is not an important effect.
A more general question related to the above came up in a review of a paper of mine recently. In our paper we had shown that a large effect that had been found previously in the literature becomes tiny (but remains significant) when we control word frequency. The reviewer objected that this finding may be important for computational modelers, who make quantitative predictions about that effect, what why should experimentalists care? I.e., why should people who only make qualitative (boolean) predictions about the effect care about the result, when the outcome is qualitatively the same?
My own understanding is that practical significance matters even in such theoretical explorations, and whether one implements a computational model or is reasoning qualitatively about data is irrelevant.
My reply:
Stefan Van Dongen writes,
I am currently struggling (as a non-mathematician) to find a way to get appropriate priors for a multivariate normal with zero means, and SDs equal to 1 such that the off diagonals are correlations. I have tried the bugs list but got no solution.
My reply:
Gerlinde Schuller sent me this link. This is bad in so may ways, most notably in its focus on the shapes of countries and its huge-Greenland projection. The cutouts of the United States with a super-prominent detached Alaska are particularly horrifying. I'd suggest they make some scatterplots.
According to a recent article, a computer program can now play a decent game of Go on a 9x9 grid. I really wasn't sure this would ever happen. Andrew and I went to a talk about programming computers to play Go, about twelve years ago, and I remember that the programmers of two of the best computer Go programs were proud just because when their programs played each other, they usually played on the same portion of the board: apparently just figuring out what part of the board is worth fighting over is a hard problem, or at least hard to program.
I guess I should explain that in Go, two players take turns placing colored stones at the intersections of a grid, trying to control as much space as possible. If a group of one player's stones are completely surrounded by the other player's stones, the surrounded stones are removed from the board. You basically play until the board is full (well, not quite, but close enough). For more details, you can check wikipedia. For various reasons that were fairly clear when the programmers explained them, this is not an "easy" problem like chess.
In chess, there are maybe 20 possible moves at a given point in the game, and each leads to 20 choices for the other player, and so on. Each "I do this, he does that" is called a "move" ---the "I do this" part or the "he does that" part is called a "half move" --- so each move creates about 400 branches. A dedicated chess computer can evaluate several billion positions per second (isn't modern technology amazing?), so in about 4 minutes it can investigate every single branch to a point 5 moves down the road (that's 10 half-moves). At that point it can throw out 99.9999999% of the possibilities --- like the ones that leave it down a piece with no compensation, or the ones that leave its opponent down a piece with no compensation (because its opponent wouldn't choose those branches either) ---- and can then spend another minute or so looking farther down the promising alleys, going as far as 20 half-moves in some cases. Back when computers were a lot slower --- in the late 1980s, for example --- programmers put a lot of effort into figuring out how to evaluate each position so they could "trim the tree" earlier, and there was a general sense that we would learn about chess, and about "artificial intelligence," by working on the evaluation function. But "speed kills", and although the evaluation function for a top chess computer is indeed fairly sophisticated, the main improvement in the programs has been to simply look deeper.
With Go, the biggest problem is that there is no obvious way to "trim the tree." Oh, sure, there are a few situations in which, looking several half-moves down the road, you can tell that one player has "wasted" their moves because their pieces have been captured...but there aren't very many of these. If players just plunk down pieces at random for a while, even a long while, the odds are pretty good that neither player will have any pieces actually captured, so the number of pieces on the board will still be equal. That means that the approach that was so successful in chess --- just look at every possibility as far down the road as you can, and pick the possibility that gives you a material advantage (or other easily measured advantage) even if the other player plays optimally too --- can't work in Go, because there is no "easily measured advantage."
I haven't had a chance to read the paper describing the approach taken by the new Go program, "Bandit based Monte-Carlo Planning" by Levente Kocsis and Csaba Szepesvari, but it seems like it should be worth at least a glance.
The New Yorker ran an article about an origami guy (Robert Lang) without any pictures of origami. Lang's webpage is here and has lots of pictures, including this tarantula:

with the following crease pattern:
Jacks are better than 10's, but just a little better. I suspect jacks are generally overvalued because they are face cards. I'm not sure how I'd use this knowledge (supposing for a moment that my conjecture is actually true), it's just a thought I had after reading a couple of books about poker.
Simon Jackman sends along a link to this site that does searches for R. Could be useful . . .
Aleks sent along info on this project by Christian Ritz and Jens C. Streibig for an R package for bioassays. We should talk with them since we're currently developing our Bayesian method for serial dilution assays (see our 2004 Biometrics paper here) and implementing it partly in R.
In a recent discussion at Machine Learning (Theory) blog the website called Faculty of 1000 (Biology) and Faculty of 1000 (Medicine) came up. It works as follows: users submit papers they like, and there is space for supporting and dissenting comments centered around the paper. This is the peer review as it should be done, not the opaque and time-consuming system currently in place with the journals.
As an example of a discussion, consider this example of one the highest rated papers, Why most published research findings are false. Do examine the negative reviews, or dissents, along with the response of the author.
What's still missing from the Internet are instruments of identity, trust and renumeration, but they should be up and running in a few years. As for trust, needed for guaranteeing high-quality information, Faculty of 1000 does institute "section heads" and "faculty members" for different topic areas. As for renumeration, needed to keep the whole thing running, there seems to be some sort of a subscription model with the Faculty of 1000 that might lock people out of the system unless they are affiliated with a major institution. I wish this was integrated with the idea of the Public Library of Science open access model.
Valdis Krebs (who is also one of the writers at the Network Weaving blog) has examined the book co-purchasing data from Amazon:

The new thing in Valdis' regular analyses is that there is a tripartite structure in the book purchasing data: we have purple quantitative/science/liberal (pointy-headed?) books centered on "Freakonomics", red pro-interventionist religion-partisan books centered on "America Alone", "Politically Correct Guide to Islam" and "Godless", and blue anti-interventionist cross-religion books centered on "The Looming Tower" and "Fiasco: The American Military Adventure in Iraq". The is considerable distance from purples and reds. While Krebs marks "The God Delusion" as purple, I see it more as a separate anti-religion cluster shared both by blue and by purple.
I have written about the recommender technology, an application area of data mining. In particular, with recommender technology, books get recommended to readers based on the history of their purchases. What this means in practice, however, is that people will be recommended more of the same. Such technology will have a clustering effect on the people in the sense that once the machine has established that someone is, say, a Democrat, only those books that are in alignment with the Democrat perspective will be recommended to him. Contrast this with the current recommendation "technology" based on bookstore aisles where one finds books on politics in a single section - with a mix of perspectives.
Internet allows us to transcend geography. When it becomes faster to talk to a colleague on a different floor using email and instant messaging than it is to meet in person, there is not much to geography beyond time zones. But there is only a limited number of associations we can develop with other people. For that matter, when geographic similarity matters less, other aspects that determine whether a bond will develop between two people begin to matter more.
When one allows people to settle where similar people live, the geography is going to mirror these clusters, and political opinions will be increasingly geographically clustered. In particular, observe how blue are the urban centers. While this picture might be of the USA, the same pattern also appears in Europe.
For example, I often wonder if New York is really a diverse environment. It is diverse in the sense that it hosts a vast number of diverse circles, but these circles tend to be disconnected from one another. I would even say that people within each circle are a lot more similar ideologically, intellectually and educationally than any "non-diverse" environment of a small town, where different people have to learn how to live together. In a big city, one can pick who you're going to spend time with, so one doesn't have to adapt. Without this, people grow apart, perhaps even stop understanding or feeling for the "other" group of people. With sufficient geographic clustering over the span of several generations, one again ends up with borders, civil wars and similar. And with the internet, one can grow apart without even moving, meaning that we can see this clustering at a faster and faster rate and the consequent conflict even sooner. Some things never change.
Jens Hainmueller has an interesting entry here about estimating the causal effects of the 2004 Madrid bombing on the subsequent Spanish elections, by comparing regular votes to absentee votes that were cast before the bombing. Jens cites a paper by Jose Montalvo that uses difference-in-difference estimation; that is, a comparison of this form:
[(avg of treated units at time 2) - (avg of controls at time 2)] - [(avg of treated units at time 1) - (avg of controls at time 1)]
I'm sure this is fine, but it's just a special case of lagged regression where the lag is restricted to have a coefficient of 1. In educational research, this is sometimes called the analysis of "gain scores." In any case, you're generally limiting your statistical efficiency and range of applicability by using differences rather than the more general regression formulation.
I can see why people set up these difference models--if you have a model with error terms for individual units (in this case, precincts or whatever--I can't actually get the link to the Montalvo paper), then differencing makes the error terms drop out, seemingly giving a cleaner estimator. But once you realize that it's a special case of regression, and you start thinking of things like regression to the mean (not to mention varying treatment effects), you're led to the more general lagged regression.
Not that lagged regression solves all problems. It's just better than difference in differences.
P.S. Actually, I would expect there to be varying treatment effects in the Spanish election example.
The New York Times has published yet another article about "market" approaches to predicting outcomes: people essentially wager on an outcome (like "Barack Obama wins the 2008 presidential election"). The article points out that on the website Intrade.com, the "market" had decided that the Republicans would lose control of the U.S. Senate by about 2am on election night, even though the news and political pundits were reporting that the Republicans appeared to be holding on by one seat. The article goes on to say the usual good things about markets, and says:
N. Gregory Mankiw, a former adviser to President Bush, who has written about Intrade on his blog, explains it this way: “Everybody has information from their own little corner of the universe, and they’d like to know the information from every other corner of the universe. What these markets do is provide a vehicle that reflects all that information.”
I don't disapprove of these "information markets" and I think they're kinda fun, and potentially even useful. But these sites might not be illustrations of the power of the market to correctly take disparate sources of information into account in order to make a prediction. Instead, they might be illustrations of the fact that if you have information that is not available to other people, you can make a better prediction than they can. Even the name of the site that is mentioned, "Intrade.com", carries the suggestion of "insider trading." For example, suppose you were a poll worker in Virginia and you knew two things that were not known to the media or the public at midnight on election day: (1) most of the highly Democratic precincts have not reported yet, and (2) the ones that have, have been even more strongly Democratic than usual. Of course you would have good reason to think the Republicans would lose the Senate, and you could log into Intrade.com or some other similar site and put your money down. And the market price would indeed reflect your knowledge. But what is at work here isn't the magical power of markets to use all of the available information, it's the magical power of "insider" information to let you make a better prediction. If the same information were available to CNN...or to me, for that matter...we wouldn't need "the market" to tell us the Democrats would win the Senate. I'm not sure the Intrade.com market was actually integrating information any better than the pundits, their bettors/investors might have just had better information.
Finally, I'd like to see some graphs of the raw data, along with replicated datasets from the model. The paper admirably connects the underlying problem to the statistical model; however, the Bayesian approach requires a lot of modeling assumptions, and I'd be a lot more convinced if I could (a) see some of the data and (b) see that the fitted model would produce simulations that look somewhat like the actual data. Otherwise we're taking it all on faith.
A colleague heard this and commented that I considered various alternative possibilities, for example ten straight heads or ten straight tails, but not other possibilities such as alternation between heads and tails. He also wondered if I was too confident in saying I could correctly identify the true and fake sequences and suggested I could report my posterior probability of getting the correct identification.
My reply:
Robin Hanson asks the following question here:
How does the distribution of truth compare to the distribution of opinion? That is, consider some spectrum of possible answers, like the point difference in a game, or the sea level rise in the next century. On each such spectrum we could get a distribution of (point-estimate) opinions, and in the end a truth. So in each such case we could ask for truth's opinion-rank: what fraction of opinions were less than the truth? For example, if 30% of estimates were below the truth (and 70% above), the opinion-rank of truth was 30%.If we look at lots of cases in some topic area, we should be able to collect a distribution for truth's opinion-rank, and so answer the interesting question: in this topic area, does the truth tend to be in the middle or the tails of the opinion distribution? That is, if truth usually has an opinion rank between 40% and 60%, then in a sense the middle conformist people are usually right. But if the opinion-rank of truth is usually below 10% or above 90%, then in a sense the extremists are usually right.
My response:
1. As Robin notes, this is ultimately an empirical question which could be answered by collecting a lot of data on forecasts/estimates and true values.
2. However, there is a simple theoretical argument that suggests that truth will be, generally, more extreme than point estimates, that the opinion-rank (as defined above) will have a distribution that is more concentrated at the extremes as compared to a uniform distribution.
The argument (with pictures) goes as follows:
Robin Hanson writes at the Overcoming Bias blog expressing the worry that clever ideas that appear first in blog entries will get used, without credit, by academic researchers, thus leaving the original blog posters with no credit (and, ultimately, less motivation to post interesting new ideas). I'm of two minds on this.
Yes, it would piss me off immensely to see my ideas (or even worse, my exact words) used by others without full credit.
On the other hand, ideas are cheap. I'm reminded of a quote I once saw on one of those inspirational-sayings-for-every-day desk calendars: "To have ideas is to gather flowers. To think is to weave them into garlands." Thinking is the hard work, and one of the fun things about blogging is that I can set out my ideas without having to think hard about them. So, yes, if you take an idea or sentence you see here, please credit me, but if you can take it further (to the level that it can appear in a scholarly publication), you deserve full credit for that.
To put it another way: every now and then, I see a published article and think: "I had that idea 10 years ago but never got around to writing it up." But I'm sure that often when I publish an article, various readers have the same thought.
Robin Hanson points to a list of methods for detecting lies:
1. Look for inconsistencies
2. Ask unexpected questions
3. Compare to when they truth-tell
4. Watch for fake smiles and emotions
5. Listen to your gut reaction
6. Watch for microexpressions
7. Are words and gestures consistent
8. Are they unusually uneasy
9. Watch for too much detail
10. Focus on the truths you find
In response, billswift comments that items 2,4,5,8,9 would be failed by autistic people, even if not lying.
I'd like to add to this that items 4,5,6,8 can be failed by people with Tourette's syndrome, since an inability to look people in the eye is often taken as a sign of untrustworthiness (hence, flagging items 4 and 5), twitching can be taken as a sign of uneasiness (item 8) as well as allowing the observer to read in all sorts of microexpressions (item 6). After all, "shifty-eyed" people are liars, right?
More generally, the whole "gut reaction" thing can reinforce prejudice against anyone who behaves differently.
This is not to say that these lie-detection methods don't work--I'd be interested in seeing the details of an empirical study--but it's no fun being on the other end of this sort of appraisal.
P.S. In a comment on Robin's blog, Anders Sandberg writes,
David Madigan pointed me to this interesting analysis of internet weather forecasts. I think the person who wrote the article was pretty annoyed. Key quote:
The hail, rain and lightning eventually subsided, but the most alarming news was waiting on cell phone voicemail. A friend who lived in the area had called frantically, knowing we were at the park, as the local news was reporting multiple people had been by struck by lightning at Schlitterbahn during the storm."So much for the 0% chance of rain," I repeated.
The post continues with analysis of temperature forecasts, but maybe they'll go back and look at precipitation too. They also have to work on their graphs--but that's the trouble with using Excel, I suppose. Here's an example:
The jar of quarters is my favorite, but I like all of them.
As a researcher and teacher in decision analysis, I've noticed a particular argument that seems to have a lot of appeal to people who don't know better. I'll call it the one-sided bet. Some examples:
- How much money would you accept in exchange for a 1-in-a-billion chance of immediate death? Students commonly say they wouldn't take this wager for any amount of money. Then I have to explain that they will do things such as cross the street to save $1 on some purchase, there's some chance they'll get run over when crossing the street, etc. (See Section 6 of this paper; it's also in our Teaching Statistics book.)
- Goals of bringing the levels of various pollutants down to zero. With plutonium, I'm with ya, but other things occur naturally, and at some point there's a cost to getting them lower. And if you want to get radiation exposure down to zero, you can start by not flying and not living in Denver.
- Pascal's wager: that's the argument that you might as well believe in God because if he (she?) exists, it's an infinite benefit, and if there is no god, it's no loss. (This ignores possibilities such as: God exists but despises believers, and will send everyone but atheists to hell. I'm not saying that this highly likely, just that, once you accept the premise, there are costs to both sides of the bet.) See also this from Alex Tabarrok and this from Lars Osterdal.
- Torture and the ticking time bomb: the argument that it's morally defensible (maybe even imperative) to torture a prisoner if this will yield even a small probability of finding where the ticking (H)-bomb is that will obliterate a large city. Again, this ignores the other side of the decision tree: the probability that, by torturing someone, you will motivate someone else to blow up your city.
- Anything having to do with opportunity cost.
- The argument for buying a lottery ticket: $1 won't affect my lifestyle at all, but even a small chance of $1 million--that will make a difference! Two fallacies here. First, most lottery buyers will get more than 1 ticket, so realistically you might be talking hundreds of dollars a year, which indeed could affect your standard of living. Second, there actually is a small chance that the $1 can change your life--for example, that might be the extra dollar you need to buy a nice suit that gets you a good job, or whatever.
There are probably other examples of this sort of argument. The key aspect of the fallacy is not that people are (necessarily) making bad choices, but that they only see half of the problem and thus don't realize there are tradeoffs at all.
P.S. When I was young and stupid, I spent some time trying to convince a student in my intro statistics class that it was a bad idea to play the lottery. In retrospect, I should've told him that it was fine, and just delineated where the probability calculations were relevant (for example, if he were to play the lottery twice a week for a year, or whatever).
Jon Zhang writes,
I [Jon] am currently programming in C (for computational speed) using GSL, do you anyone in the dept who has written a probit or tobit code in GSL so there is no need to reinvent the wheel?
My only comment is that we have bayesglm() in our "arm" package in R.
Joe asks about models for compositional data. We have an example in this paper on toxicology from 1996 (also briefly covered in the "nonlinear models" chapter in BDA). In the paper, it's discussed in the last paragraph of p.1402 and continues on to p.1403.
Statisticians often get worried about multiple comparisons and have various procedures for adjusting p-values. It's only very rarely come up in my own research, though. Here's a presentation explaining why, from a workshop of educational researchers to which I was invited by Rob Hollister, an economist and policy analyst at Swarthmore College.
The punch line is that multilevel models do well by doing partial pooling on the point estimates, as compared to classical multiple comparisons methods which leave the estimates unchanged and just make the confidence intervals wider.
P.S. In answer to Vasishth's comment: we did some computations and simulations to illustrate this point in this article (with Francis Tuerlicnkx) that appeared in Computational Statistics in 2000. See also this discussion with Nick Longford.
I came across this abstract from Mylene Bedard:
Optimal acceptance rates for Metropolis algorithms: moving beyond 0.234In this talk, we shall optimize the efficiency of random walk Metropolis algorithms for multidimensional target distributions with scaling terms possibly depending on the dimension. We show that when there does not exist any component having a scaling term significantly smaller than the others, the asymptotically optimal acceptance rate is the well-known 0.234. We also show that when this condition is not met the limiting process of the algorithm is altered, yielding an asymptotically optimal acceptance rate which might drastically differ from the usual 0.234. In particular, we prove that as the d increases the sequence of stochastic processes formed by say the component of each Markov chain usually converges to a Langevin diffusion process with a distinct speed measure, except in particular cases where it converges to a onedimensional Metropolis-Hastings algorithm with a singular acceptance rule. We also discuss the use of inhomogeneous proposals, which might reveal essential in specific cases.
This makes me so happy--the well-known 0.234. It's so cool to have a mathematical constant all my own (ok, I guess it's shared with Gareth, Wally, and Yuval, but still...). This kind of thing makes it all worth it.
Just for laffs, I googled "0.234", and our result was the 6th link! Not quite the fame of "137" but still something.
P.S. Here's Bedard's paper and here's the original 0.234 paper where it all started. It was lots of fun figuring that out. (And I'm sure Gareth and Jeff have had lots of fun extending these results far beyond anything I could've done.)

Aleks send me this (the link, that is, not the actual food).
Vivek Mohta asks (in a comment here) the following:
The conclusion [of some research on election forecasting] seems to be that presidential election results turn primarily on the *performance* of the party controlling the White House. The political views of and campaigning by the challenging candidate (within historical norms) have little to no impact on results.The most recent paper applying this method is The Keys to the White House: Forecast for 2008. I haven't yet looked at the original paper from 1982 where the method is developed. But there was a reference to his work in the Operations Research Today: "His method is based on a statistical pattern recognition algorithm for predicting earthquakes, implemented by Russian seismologist Volodia Keilis-Borok. In English-language terminology, the technique most closely resembles kernel discriminant function analysis."
My thoughts:
Kjetil Halvorsen reports that news from the fake cancer study in Norway (best quote: "of the 908 people in Sudbo's study, 250 shared the same birthday") has been summarized here. No jail time, but his license to practice medicine and dentistry were revoked. No big fat fine and no community service--maybe the authorities decided that prosecution was too much effort. I still think that at the very least he should have to clean the toilets at a dental clinic every week for a few years. (But no, I don't think I should be punished for the false theorem I published--that's different since it was a mistake, not fraud.)
Seth writes,
If I [Seth] taught journalism . . . I would tell my students the best thing is a story of success . . . because we can always learn from it. Next best is a story of failure because we can always learn from that, too. Worst is to quote experts (e.g., Pollan quotes Marion Nestle). For two reasons: 1. Experts are often wrong. When they are, it is worse than learning nothing — we are actively misled. 2. Experts — at least in standard journalism — never say the facts on which their claims are based. Even if they are correct, what the reader learns from quoting them is shallow.
I have mixed feelings about this attitude.
The first printing of the new book had some production problems. Nothing too serious (corrected pages are here), but Cambridge is making a second printing, which is why it's currently unavailable on Amazon. The second printing should be arriving in a few weeks.
P.S. The blurbs are all valid, and I still think this would be an ideal textbook for any course in regression or generalized linear models, as well as a great way to learn the stuff on your own.
P.P.S. Some typos (and even mistakes) are inevitable; for example, see here for the errata list for the first printing of the first edition of BDA. It only took us close to 10 years to collect those! For the new book, though, the publishing equivalent of a freak accident occurred: the copy editor and both authors looked carefully at the page proofs, but then a glitch arose after this in a final production stage. Some problem with postscript fonts in some of the graphs. It's embarrassing but doesn't have too much effect on the content (and now some lucky few have rare pre-recall first printings!).
I don't have much to say here, except that the concept of "unintended consequences" is so appealing that I think it's often applied to settings where the consequences actually were anticipated and intended, at least by some of the parties involved.
I applied for a bunch of jobs my senior year, I got rejection letters from all of them and, as was customary with MIT seniors, I taped them to my dorm room door. I got into grad school, so it was ok, but years later I'm wondering: how did those 8 companies know to reject me? I mean, an MIT physics major with good grades is a good thing to have, right? At the time, we all just took it for granted that we'd get tons of rejections, but in retrospect I wonder if those companies were being a little silly to just summarily throw out the resumes of so many MIT students. (I can't take it personally since it was my resume they were rejecting--it never got to the interview stage.) I wonder who they hired instead?
Ernest Drucker sent along this paper along with this story:
I [Drucker] have been speaking about the problem of mass imprisonment for years to anyone who would listen – mostly professional groups and students. Once I spoke to the Urban League national convention in Pittsburgh - to little response. But one such talk was to the medical students at Einstein where I teach - they had organized a social medicine course outside the formal curriculum and I was happy to see their interest went beyond clinical medicine. My topic was the epidemiology of incarceration. I showed all my usual PPT slides – tables of data showing the sharp rise in imprisonment in the USA over the last 30 years- and of how far imprisonment had spread in the black community. I talked about the epidemic and our countries drug war policies – something I’ve done dozens of times.But in the audience was Dean S who came up to me after the presentation and asked if Id be willing to give the same talk to her group of students – who it turned out were all in High school in the Bronx. They were in the Einstein program to bring Bronx HS kids into the medical school labs and hospitals – to let them see about medical science and maybe interest them in careers in health in some way. As select HS students many would go to college, so maybe it was a bit of early recruiting of local talent for Einstein admission in 4 or 5 years. They came from most of the public and parochial high school of the Bronx, but these kids were the pick of the crop. To be in the program they had to sign up in advance fore limited number of slots, they had to get up there to Einstein every week for a term, and their parents were supposed to come in too- for a conference with Dean S about their progress. These were serious kids from families that support their academic goals ands valued education enough to go to some extra trouble to cultivate it.
As I often do with audiences, I asked who had ever had a family member or close friend go to prison. To my amazement they all raised their hands – 100% of them had a member who had been in prison - that’s a very simple and striking measure of the prevalence of incarceration at this time in the Bronx – every family in this select group was affected directly by incarceration.
We'll be talking with Ernie this Thursday in the social networks working group. His work seems related to the ideas of this paper (or at least to its title).
Here's another one from Chance News (scroll down to "Hot streaks rarely last"), John Gavin refers to an interesting article from the Wall Street Journal by Sam Walker about a guy called Dr. Bob who has a successful football betting record:
YEAR WIN/LOSS/TIE %
1999 49-31-1 61%
2000 47-25-0 65%
2001 35-28-0 56%
2002 49-44-3 53%
2003 46-55-2 46%
2004 55-34-1 62%
2005 51-21-2 71%
2006 45-34-3 57%
Chris Paulse writes,
From Chance News (scroll down to "A Challenge"), Laurie Snell writes:
The mathematics department at Dartmouth has just moved to a new building and the previous math building is being demolished. The students called this building "Shower Towers" suggest by this picture of one wall of the building.
For at least 30 years we walked by this wall assuming that the tiles were randomly placed. One day, as we were walking by it, our colleaugue John Finn said "I see they are not randomly placed." What did he see?
This is sort of a funny quote, though, from a statistician's perspective, because those of us who do survey sampling know that random assignment is hard: in this case, they'd either have to have a pile of tiles that they randomly select from, or else take tiles and put them in random locations. Neither of these is easy, as it requires picking random numbers from a long list, or physical randomization of a really heavy pile of tiles!
Sometimes statisticians use the word "haphazard" to represent processes that do not have any known distribution and so would not be called "random" in the usual statistical sense.
From Sports Media Watch, via Can't Stop the Bleeding. Kareem appears to be a Democrat, but he gave to Bill Bradley so maybe this doesn't really count.
Sarah Igo came yesterday in our seminar to tell us about her recent book, The Averaged American. It was a lot of fun, and she commented that when she speaks to historians, they just let her speak, but we're more fun because we interrupt her frequently. I assured her that if interruption=fun, then economists are the most fun of all...
The talk was an interesting historical overview of the Middletown, Gallup, and Kinsey surveys with some fun historical photos. One of the best things about the photos was the hidden world they revealed--all the things in the backgrounds. It reminded me of when I watched a bunch of Speed Racer cartoons with Phil in a movie theater in the early 90s. These were low-budget Japanese cartoons from the 60s that we loved as kids. From my adult perspective, the best parts were during the characters' long drives, where you could see Japanese industrial scenes in the background.
Survey costs and technology
To get back to Igo's topic: her main theme was how the existence of surveys changed Americans' ideas of the mass public as an agglomeration of individuals rather than interest groups or social classes. Thinking about the changes since the 1950s, there are a lot more polls now, and this would seem to be technology-driven: it's just a lot cheaper to do a survey now than it used to be. I actually think it should be considered unethical to survey people without compensating them.
Relevant to the discussion here is the hilarious (but sad) movie Our Brand is Crisis, which shows U.S. political consulting techniques being introduced in Bolivia.
What do we learn from polls?
There was a lively discussion in the seminar about what people learn from surveys. Most obviously, they learn issue opinions, for example that most people support the death penalty, the country is divided on abortion, and most people oppose the Iraq war. I commented that this tends to reduce the "availability bias" under which people tend to think that most people share their opinions on issues: for example, I might think everyone supports my preferred Presidential candidate, but a simple poll will tell me it's 50/50. But a couple of other possibilities came up:
1. Majorities can be politically strentghened. For example, once it is known that over 60% of the people agree with them, this strengthens the political efforts of death penalty advocates.
2. Minorities can be politically strengthened, for example, when Kinsey's results were extrapolated to estimate that 10% of Americans were gay [this was questionable for methodological reasons, but that's another story].
3. Tolerance: once I realize that I'm on the minority in many issues, I become more tolerant of minority rights in general. Of course, most people are in the majority in any given issue (if there are 2 options), but each of us is in the minority on some issues.
4. Polling and the illusion of control: According to Igo, presidents from Roosevelt on have had internal polling organizations. I conjecture that this convenient polling gives politicians the illusion that they can't lose--that they can just use polling to alter their pitches until they come up with something popular.
Chris Anderson popularized the idea that internet will fundamentally change the way media works: while the mass media and retail create a small number of big hits, the internet will "flatten" the field in the sense that there will be a large number of smaller hits. There are particular reasons for short-tailed world:
Ilya Grigorik used the Netflix data (I have written about his analysis already) to examine the shifts in the taste across years on Netflix. He finds that with years from 2000 to 2005, the head has grown bigger, but the tail thinner:

The blockbusters have increased, while the tail has become thinner, especially among the hits. On the first sight, this would appear to indicate that the long-tailed vision is wrong. I disagree: the reasons lie in marketing. There is a distinct difference between early adopters and late adopters. Early adopters are more experimental in their tastes, which is the fundamental reason why they would go bother with novelty services. Moreover, they cannot find their favorite niche movie in the local Blockbuster, driving them towards mail distribution.
As the early adopters spread the word, as Netflix polishes up their service and reduces the cost, more and more of the late adopters join the ranks of Netflix customers, but these late adopters 1) do not have the itch for the rare 2) are not experimental 3) are still largely governed by the mass media. My guess is that the thinning of the tail is temporary.
In response to a summary by Alfred G. Cuzán of election forecasts, I wrote,
A group of from University of California in Los Angeles, including the popular author of books on Bayesian networks (sometimes referred to as belief networks or as graphical models, as they aren't Bayesian in the Bayesian statistics sense) and causality Judea Pearl, have set up a new blog on causality. Their approach to causality is based on probability theory with random variables and operators. For a taste of it, see "Causality is undefinable" or "The meaning of counterfactuals".
While it takes the form of a blog, the system is more like a help line. The good stuff is often in the comments.


Recent Comments