Results matching “R”

Inbox zero. Really.

Just in time for the new semester:

inboxzero.png

This time I'm sticking with the plan:

1. Don't open a message until I'm ready to deal with it.
2. Don't store anything--anything--in the inbox.
3. Put to-do items in the (physical) bookje rather than the (computer) "desktop."
4. Never read email before 4pm. (This is the one rule I have been following.
5. Only one email session per day. (I'll have to see how this one works.)

At the sister blog, David Frum writes, of a book by historian Laura Kalman about the politics of the 1970s:

Masanao sends this one in, under the heading, "another incident of misunderstood p-value":

Warren Davies, a positive psychology MSc student at UEL, provides the latest in our ongoing series of guest features for students. Warren has just released a Psychology Study Guide, which covers information on statistics, research methods and study skills for psychology students.
Despite the myriad rules and procedures of science, some research findings are pure flukes. Perhaps you're testing a new drug, and by chance alone, a large number of people spontaneously get better. The better your study is conducted, the lower the chance that your result was a fluke - but still, there is always a certain probability that it was.

Statistical significance testing gives you an idea of what this probability is.

In science we're always testing hypotheses. We never conduct a study to 'see what happens', because there's always at least one way to make any useless set of data look important. We take a risk; we put our idea on the line and expose it to potential refutation. Therefore, all statistical tests in psychology test the possibility that the hypothesis is correct, versus the possibility that it isn't.

I like the BPS Research Digest, but one more item like this and I'll have to take them off the blogroll. This is ridiculous! I don't blame Warren Davies--it's all-too-common for someone teaching statistics to (a) make a mistake and (b) not realize it. But I do blame the editors of the website for getting a non-expert to emit wrong information. One thing that any research psychologist should know is that statistics is tricky. I hate to see this sort of mistake (saying that statistical significance is a measure of the probability the null hypothesis is true) being given the official endorsement of British Psychological Society.

P.S. To any confused readers out there: The p-value is the probability of seeing something as extreme as the data or more so, if the null hypothesis were true. In social science (and I think in psychology as well), the null hypothesis is almost certainly false, false, false, and you don't need a p-value to tell you this. The p-value tells you the extent to which a certain aspect of your data are consistent with the null hypothesis. A lack of rejection doesn't tell you that the null hyp is likely true; rather, it tells you that you don't have enough data to reject the null hyp. For more more more on this, see for example this paper with David Weakliem which was written for a nontechnical audience.

P.P.S. This "zombies" category is really coming in handy, huh?

Dave Armstrong writes:

Subhadeep Mukhopadhyay writes:

I am convinced of the power of hierarchical modeling and individual parameter pooling concept. I was wondering how could multi-level modeling could influence the estimate of grad mean (NOT individual label).

My reply: Multilevel modeling will affect the estimate of the grand mean in two ways:

1. If the group-level mean is correlated with group size, then the partial pooling will change the estimate of the grand mean (and, indeed, you might want to include group size or some similar variable as a group-level predictor.

2. In any case, the extra error term(s) in a multilevel model will typically affect the standard error of everything, including the estimate of the grand mean.

Andrew Eppig writes:

I'm a physicist by training who is transitioning to the social sciences. I recently came across a reference in the Economist to a paper on IQ and parasites which I read as I have more than a passing interest in IQ research (having read much that you and others (e.g., Shalizi, Wicherts) have written). In this paper I note that the authors find a very high correlation between national IQ and parasite prevalence. The strength of the correlation (-0.76 to -0.82) surprised me, as I'm used to much weaker correlations in the social sciences. To me, it's a bit too high, suggesting that there are other factors at play or that one of the variables is merely a proxy for a large number of other variables. But I have no basis for this other than a gut feeling and a memory of a plot on Language Log about the distribution of correlation coefficients in social psychology.

So my question is this: Is a correlation in the range of (-0.82,-0.76) more likely to be a correlation between two variables with no deeper relationship or indicative of a missing set of underlying variables?

My reply:

Gladwell vs Pinker

I just happened to notice this from last year. Eric Loken writes:

Steven Pinker reviewed Malcolm Gladwell's latest book and criticized him rather harshly for several shortcomings. Gladwell appears to have made things worse for himself in a letter to the editor of the NYT by defending a manifestly weak claim from one of his essays - the claim that NFL quarterback performance is unrelated to the order they were drafted out of college. The reason w [Loken and his colleagues] are implicated is that Pinker identified an earlier blog post of ours as one of three sources he used to challenge Gladwell (yay us!). But Gladwell either misrepresented or misunderstood our post in his response, and admonishes Pinker by saying "we should agree that our differences owe less to what can be found in the scientific literature than they do to what can be found on Google."

Well, here's what you can find on Google. Follow this link to request the data for NFL quarterbacks drafted between 1980 and 2006. Paste the data into a spreadsheet and make a simple graph of touchdowns thrown (as of 2008) versus order of selection in the draft to create the picture below.

image0011.png

David Shor writes:

Michael Bader writes:

R needs a good function to make line plots

More and more I'm thinking that line plots are great. More specifically, two-way grids of line plots on common scales, with one, two, or three lines per plot (enough to show comparisons but not so many that you can't tell the lines apart). Also dot plots, of the sort that have been masterfully used by Lax and Phillips to show comparisons and trends in support for gay rights.

There's a big step missing, though, and that is to be able to make these graphs as a default. We have to figure out the right way to structure the data so these graphs come naturally.

Then when it's all working, we can talk the Excel people into implementing our ideas. I'm not asking to be paid here; all our ideas are in the public domain and I'm happy for Microsoft or Google or whoever to copy us.

P.S. Drew Conway writes:

This could be accomplished with ggplot2 using various combinations of the grammar. If I am understanding what you mean by line plots, here are some examples with code.

In fact, that website is a tremendous resource for all things data viz in R.

References on predicting elections

Mike Axelrod writes:

I [Axelrod] am interested in building a model that predicts voting on the precinct level, using variables such as party registration, age, sex, income etc. Surely political scientists have worked on this problem.

I would be grateful for any reference you could provide in the way of articles and books.

My reply: Political scientists have worked on this problem, and it's easy enough to imagine hierarchical models of the sort discussed in my book with Jennifer. I can picture what I would do if asked to forecast at the precinct level, for example to model exit polls. (In fact, I was briefly hired by the exit poll consortium in 2000 to do this, but then after I told them about hierarchical Bayes, they un-hired me!) But I don't actually know of any literature on precinct-level forecasting. Perhaps one of you out there knows of some references?

A couple years ago, I used a question by Benjamin Kay as an excuse to write that it's usually a bad idea to study a ratio whose denominator has uncertain sign. As I wrote then:

Similar problems arise with marginal cost-benefit ratios, LD50 in logistic regression (see chapter 3 of Bayesian Data Analysis for an example), instrumental variables, and the Fieller-Creasy problem in theoretical statistics. . . . In general, the story is that the ratio completely changes in interpretation when the denominator changes sign.

More recently, Kay sent in a related question:

How does Bayes do it?

I received the following message from a statistician working in industry:

I am studying your paper, A Weakly Informative Default Prior Distribution for Logistic and Other Regression Models. I am not clear why the Bayesian approaches with some priors can usually handle the issue of nonidentifiability or can get stable estimates of parameters in model fit, while the frequentist approaches cannot.

My reply:

1. The term "frequentist approach" is pretty general. "Frequentist" refers to an approach for evaluating inferences, not a method for creating estimates. In particular, any Bayes estimate can be viewed as a frequentist inference if you feel like evaluating its frequency properties. In logistic regression, maximum likelihood has some big problems that are solved with penalized likelihood--equivalently, Bayesian inference. A frequentist can feel free to consider the prior as a penalty function rather than a probability distribution of parameters.

2. The reason our approach works well is that we are adding information. In a logistic regression with separation, there is a lack of information in the likeilhood, and the prior distribution helps out by ruling out unrealistic possibilities.

3. There are settings where our Bayesian method will mess up. For example, if the true logistic regression coefficient is -20, and you have a moderate sample size, our estimate will be much closer to zero (while the maximum likelihood estimate will be minus infinity, which for some purposes might be an acceptable estimate).

Probably I should write more about this sometime. Various questions along those lines arose during my recent talk at Cambridge.

Predicting marathon times

Frank Hansen writes:

I [Hansen] signed up for my first marathon race. Everyone asks me my predicted time. The predictors online seem geared to or are based off of elite runners. And anyway they seem a bit limited.

So I decided to do some analysis of my own.

Somewhat Bayesian multilevel modeling

Eric McGhee writes:

Computer models of the oil spill

Chris Wilson points me to this visualization of three physical models of the oil spill in the Gulf of Mexico. Cool (and scary) stuff. Wilson writes:

One of the major advantages is that the models are 3D and show the plumes and tails beneath the surface. One of the major disadvantages is that they're still just models.

I sent a copy of my paper (coauthored with Cosma Shalizi) on Philosophy and the practice of Bayesian statistics in the social sciences to Richard Berk, who wrote:

I read your paper this morning. I think we are pretty much on the same page about all models being wrong. I like very much the way you handle this in the paper. Yes, Newton's work is wrong, but surely useful. I also like your twist on Bayesian methods. Makes good sense to me. Perhaps most important, your paper raises some difficult issues I have been trying to think more carefully about.

1. If the goal of a model is to be useful, surely we need to explore that "useful" means. At the very least, usefulness will depend on use. So a model that is useful for forecasting may or may not be useful for causal inference.

2. Usefulness will be a matter of degree. So that for each use we will need one or more metrics to represent how useful the model is. In what looks at first to be simple example, if the use is forecasting, forecasting accuracy by something like MSE may be a place to start. But that will depend on one's forecasting loss function, which might not be quadratic or even symmetric. This is a problem I have actually be working on and have some applications appearing. Other kinds of use imply a very different set of metrics --- what is a good usefulness metric for causal inference, for instance?

3. It seems to me that your Bayesian approach is one of several good ways (and not mutually exclusive ways) of doing data analysis. Taking a little liberty with what you say, you try a form of description and if it does not capture well what is in the data, you alter the description. But like use, it will be multidimensional and a matter of degree. There are these days so many interesting ways that statisticians have been thinking about description that I suspect it will be a while (if ever) before we have a compelling and systematic way to think about the process. And it goes to the heart of doing science.

4. I guess I am uneasy with your approach when it uses the same data to build and evaluate a model. I think we would agree that out-of-sample evaluation is required.

5. There are also some issues about statistical inference after models are revised and re-estimated using the same data. I have attached ">a recent paper written for criminologists, co-authored with Larry Brown and Linda Zhao, that appeared in Quantitative Criminology. It is frequentist in perspective. Larry and Ed George are working on a Bayesian version. Along with Andreas Buja and Larry Shepp, we are working on appropriate methods to post-model selection inference, given that current practice is just plain wrong and often very misleading. Bottom line: what does one make of Bayesian output when the model involved has been tuned to the data?

My reply:

I agree with your points #1 and #2. We always talk about a model being "useful" but the concept is hard to quantify.

I also agree with #3. Bayes has worked well for me but I'm sure that other methods could work fine also.

Regarding point #4, the use of the same data to build and evaluate the model is not particularly Bayesian. I see what we do as an extension of non-Bayesian ideas such as chi^2 tests, residual plots, and exploratory data analysis--all of which, in different ways, are methods for assessing model fit using the data that were used to fit the model. In any case, I agree that out-of-sample checks are vital to true statistical understanding.

To put it another way: I think you're imagining that I'm proposing within-sample checks as an alternative to out-of-sample checking. But that's not what I'm saying. What I'm proposing is to do within-sample checks as an alternative to doing no checking at all, which unfortunately is the standard in much of the Bayesian world (abetted by the subjective-Bayes theory/ideology). When a model passes a within-sample check, it doesn't mean the model is correct. But in many many cases, I've learned a lot from seeing a model fail a within-sample check.

Regarding your very last point, there is some classic work on Bayesian inference accounting for estimation of the prior from data. This is the work of various people in the 1960s and 1970s on hierarchical Bayes, when it was realized that "empirical Bayes" or "estimating the prior from data" could be subsumed into a larger hierarchical framework. My guess is that such ideas could be generalized to a higher level of the modeling hierarchy.

Eric Mvukiyehe and Cyrus Samii write:

We [Mvukiyehe and Samii] use original survey data and administrative data to test a theory of the micro-level impacts of peacekeeping. The theory proposes that through the creation of local security bubbles and also through direct assistance, peacekeeping deployments contribute to economic and social revitalization that may contribute to more durable peace. This theory guides the design of current United Nations peacekeeping operations, and has been proposed as one of the explanations for peacekeeping's well-documented association with more durable peace.

Our evidence paint a complex picture that deviates substantially from the theory. We do not find evidence for local security bubbles around deployment base areas, and we do not find that deployments were substantial contributors to local social infrastructure. In addition, we find a negative relationship between deployment basing locations and NGO contributions to social infrastructure.

Nonetheless, we find that deployments do seem to stimulate local markets, leading to better employment possibilities and substantially higher incomes. The result is something of a puzzle, suggesting that more work needs to be done on other types of direct assistance by peacekeeping contingents--e.g. the impact of mission procurement and routine spending by those associated with the mission. Also, the findings with respect to NGO activities suggest that this is an important factor that past case studies and cross-national studies have not taken into account sufficiently.

(I put in the boldface and the paragraph breaks to add some emphasis.)

At this point, I'd usually say, Here are the graphs. But there are no graphs! I'm sure the article will be even better once they've presented their data and model in an accessible form. In the meantime, I think these guys know what they're doing, so if you're interested in peacekeeping, you should probably read their article right away.

ARM solutions

People sometimes email asking if a solution set is available for the exercises in ARM. The answer, unfortunately, is no. Many years ago, I wrote up 50 solutions for BDA and it was a lot of work--really, it was like writing a small book in itself. The trouble is that, once I started writing them up, I wanted to do it right, to set a good example. That's a lot more effort than simply scrawling down some quick answers.

From Bannerjee and Duflo, "The Experimental Approach to Development Economics," Annual Review of Economics (2009):

One issue with the explicit acknowledgment of randomization as a fair way to allocate the program is that implementers may find that the easiest way to present it to the community is to say that an expansion of the program is planned for the control areas in the future (especially when such is indeed the case, as in phased-in design).

I can't quite figure out whether Bannerjee and Duflo are saying that they would lie and tell people that an expansion is planned when it isn't, or whether they're deploring that other people do it.

I'm not bothered by a lot of the deception in experimental research--for example, I think the Milgram obedience experiment was just fine--but somehow the above deception bothers me. It just seems wrong to tell people that an expansion is planned if it's not.

P.S. Overall the article is pretty good. My only real problem with it is that when discussing data analysis, they pretty much ignore the statistical literature and just look at econometrics. In the long run, that's fine--any relevant developments in statistics should eventually make their way over to the econometrics literature. But for now I think it's a drawback in that it encourages a focus on theory and testing rather than modeling and scientific understanding.

Here are the titles of some of the cited papers:

Bootstrap tests for distributional treatment effects in instrumental variables models
Nonparametric tests for treatment effect heterogeneity
Testing the correlated random coefficient model
Asymptotics for statistical decision rules

Most of the paper, and most of the references, are applied rather than theoretical, so I'm not claiming that Bannerjee and Duflo are ivory-tower theorists. Rather, I'm suggesting that their statistical methods might not be allowing them to get the most out of their data--and that they're looking in the wrong place when researching better methods. The problem, I think, is that they (like many economists) think of statistical methods not as a tool for learning but as a tool for rigor. So they gravitate toward math-heavy methods based on testing, asymptotics, and abstract theories, rather than toward complex modeling. The result is a disconnect between statistical methods and applied goals.

The mathematics of democracy

I was sent a copy of "Numbers Rule: The Vexing Mathematics of Democracy, from Plato to the Present," by George Szpiro. It's an interesting book that I think a lot of people will like, going over a bunch of voting paradoxes in the context of historical stories. Some of the topics (Arrow's theorem and its recent refinements) are more interesting than others (the always nauseatingly boring (to me) of the "Alabama paradox" and various rules about which states get one extra House seat; for some reason people are always writing about this topic about which I could care less). But you can pick and choose among the chapters, so unevenness isn't really such a problem.

One thing that fascinates me about the topic of mathematics and representation is how many different ways there are to look at it.

They write:

How many House seats will the Republicans gain in 2010? . . . Our methodology replicates that for our ultimately successful forecast of the 2006 midterm. Two weeks before Election Day in 2006, we posted a prediction that the Democrats would gain 32 seats and recapture the House majority. The Democrats gained 30 seats in 2006. Our current forecast for 2010 shows that the Republicans are likely to regain the House majority. . . . the most likely scenario is a Republican majority in the neighborhood of 229 seats versus 206 for the Democrats for a 50-seat loss for the Democrats.

How do they do it? First, they predict the national two-party vote using the generic polls (asking voters which party they plan to vote for in the November congressional elections). Then they apply the national vote swing on a district-by-district level to predict the outcome in each district. They account for uncertainty in their predictions (I assume by using a model similar to what Gary King and I did in 1994), which induces a probabilistic forecast of the number of districts won by each party.

Regular readers will know that this is not news. Way back in September, 2009--over eleven months ago--we used an earlier version of the Bafumi/Erikson/Wlezien model to predict a Republican House takeover in 2010. As I wrote several months ago, it feels good for once to be ahead of the story.

No radon lobby

Kaiser writes thoughtfully about the costs, benefits, and incentives for different policy recommendation options regarding a recent water crisis. Good stuff: it's solid "freakonomics"--and I mean this in positive way: a mix of economic and statistical analysis, with assumptions stated clearly. Kaiser writes:

Using the framework from Chapter 4, we should think about the incentives facing the Mass. Water Resources Authority:

A false positive error (people asked to throw out water when water is clean) means people stop drinking tap water temporarily, perhaps switching to bottled water, and the officials claim victory when no one falls sick, and businesses that produce bottled water experience a jump in sales. It is also very difficult to prove a "false positive" when people have stopped drinking the water. So this type of error is easy to hide behind.

A false negative error (people told it's safe to drink water when water is polluted) becomes apparent when someone falls sick as a result of drinking the water -- notice that it would be impossible to know if such a person is affected by bacteria from the pond water or bacteria from the main water line but no matter, any sickness will be blamed on the pond water. We think the risk is low but if it happens, the false negative error creates a public relations nightmare.

I [Kaiser] think this goes a long way to explaining why government officials behave the way they do. This applies also to the FDA and CDC in terms of foodborne diseases (a subject of Chapter 2), and to the NTSB in terms of car recalls. They tend to be overly conservative. In the case of food or product recalls, being overly conservative leads to massive economic losses and waste as food or products are thrown out, almost all of them good.

This reminds me of my work with Phil in the mid-1990s on home radon. The Environmental Protection Agency had a recommendation that every homeowner in the country measure their radon levels, and that anyone with a measurement higher than 4 picoCuries per liter get their house remediated. We recommended a much more targeted strategy which we estimated could save the same number of lives at much less cost. But the EPA resisted our approach. One thing that was going on, we decided, was that there is no pro-radon lobby. Radon is a natural hazard, and so there's no radon manufacturer's association pushing to minimize its risks. If anything, polluters like to focus on radon as it takes the hook off them for other problems. And the EPA has every incentive to make a big deal out of it. So you get a one-sided political environment leading to recommendations that are too expensive. Similar things go on with other safety issues in the U.S.

Teaching yourself mathematics

Some thoughts from Mark Palko:

Of all the subjects a student is likely to encounter after elementary school, mathematics is by far the easiest to teach yourself. . . .

What is it that makes math teachers so expendable? . . .

At some point all disciplines require the transition from passive to active and that transition can be challenging. In courses like high school history and science, the emphasis on passively acquiring knowledge (yes, I realize that students write essays in history classes and apply formulas in science classes but that represents a relatively small portion of their time and, more importantly, the work those students do is fundamentally different from the day-to-day work done by historians and scientists). By comparison, junior high students playing in an orchestra, writing short stories or solving math problems are almost entirely focused on processes and those processes are essentially the same as those engaged in by professional musicians, writers and mathematicians. Unlike music and writing, however, mathematics starts out as a convergent process. . . .

This unique position of mathematics allows for any number of easy and effective self-study techniques. . . . All you need is a textbook and a few sheets of scratch paper. You cover everything below the paragraph you're reading with the sheet of paper. When you get to an example, leave the solution covered and try the problem. After you've finished check your work. If you got it right you continue working your way through the section. If you got it wrong, you have a few choices. . . .

I have nothing to add to this except to agree that, yes, doing mathematical research (or, at least, doing mathematics as part of statistical research) really is like doing math homework problems! An oft-stated distinction is that homeworks almost always have a clear correct answer, whereas research is open-ended. But, actually, when I do math for my research, it surprisingly often does work out. Doing (applied) mathematical research is a little bit like waking through the woods: sometimes I get stuck and have to work around an obstacle, and I usually don't end up exactly where I intend to go, but I usually make some progress. And in many cases the math is smarter than I am, in the sense that, through mathematical analysis, I'm able to find a correct answer that is surprising, until I realize how truly right it is.

Also relevant is Dick De Veaux's remark that math is like music, statistics is like literature.

Dodging the diplomats

The usually-reasonable-even-if-you-disagree-with-him Tyler Cowen writes:

Presumably diplomats either enjoy serving their country or they enjoy the ego rents of being a diplomat or both. It is a false feeling of power, borrowed power from one's country of origin rather than from one's personal achievements.

Huh? I'd hardly think this needs to be explained, but here goes:

Lauryn Hill update

Juli thought this might answer some of my questions. To me, though, it seemed a bit of a softball interview, didn't really go into the theory that the reason she's stopped recording is that she didn't really write most of the material herself.

Modeling constrained parameters

Mike McLaughlin writes:

In general, is there any way to do MCMC with a fixed constraint?

E.g., suppose I measure the three internal angles of a triangle with errors ~dnorm(0, tau) where tau might be different for the three measurements. This would be an easy BUGS/WinBUGS/JAGS exercise but suppose, in addition, I wanted to include prior information to the effect that the three angles had to total 180 degrees exactly.

Is this feasible? Could you point me to any BUGS model in which a constraint of this type is implemented?

Note: Even in my own (non-hierarchical) code which tends to be component-wise, random-walk Metropolis with tuned Laplacian proposals, I cannot see how I could incorporate such a constraint.

My reply: See page 508 of Bayesian Data Analysis (2nd edition). We have an example of such a model there (from this paper with Bois and Jiang).

Term Limits for the Supreme Court?

In the wake of the confirmation of Elena Kagan to the Supreme Court, political commentators have been expressing a bit of frustration about polarization within the court and polarization in the nomination process. One proposal that's been floating around is to replace lifetime appointments by fixed terms, perhaps twelve or eighteen years. This would enforce a regular schedule of replacements, instead of the current system in which eighty-something judges have an incentive to hang on as long as possible so as to time their retirements to be during the administration of a politically-compatible president.

A couple weeks ago at the sister blog, John Sides discussed some recent research that was relevant to the judicial term limits proposal. Political scientists Justin Crowe and Chris Karpowitz analyzed the historical record or Supreme Court terms and found that long terms of twenty years or more have been happening since the early years of the court. Yes, there is less turnover than there used to be, but that is a product not so much of longer terms at the high end but of fewer judges serving very short terms.

Sides used this and other arguments to conclude that term limits for Supreme Court judges would not have much effect.

I saw John's blog and posted a disagreement, arguing that term limits could indeed have a large effect, and that, as political scientists, we shouldn't be so fast to dismiss proposed reforms.

John then replied to my arguments, again bringing in more research.

And then I replied to that.

Finally,
Crowe and Karpowitz chimed in with their thoughts: "Eighteen-year term limits may be a good idea for other reasons, but getting at the source of the recent increase in average tenure is not one of them." I still disagree, but Crowe, Karpowitz, and Sides do make a larger point that is reasonable, which is to push the discussion toward the goals of the proposed reforms rather than to treat shorter terms as an end in themselves.

Beyond everything else, I'd hope that term limits would remove some of the mystique of the Supreme Court, starting with the idea that they're called "justices" rather than simply "judges," which is what they are. It's almost as if they are considered to be the personification of justice.

I agree with Crowe and Karpowitz that these problems are not new. Roger Taney was 80 years old when he ruled on the Dred Scott case, which is, I believe, the consensus for the worst call in Supreme Court history. The case came on his 22nd year on the Court.

My cobloggers sometimes write about "Politics Everywhere." Here's an example of a political writer taking something that's not particularly political and trying to twist it into a political context. Perhaps the title should be "political journalism everywhere".

Michael Kinsley writes:

Scientists have discovered a spinal fluid test that can predict with 100 percent accuracy whether people who already have memory loss are going to develop full-fledged Alzheimer's disease. They apparently don't know whether this test works for people with no memory problems yet, but reading between the lines of the report in the New York Times August 10, it sounds as if they believe it will. . . . This is truly the apple of knowledge: a test that can be given to physically and mentally healthy people in the prime of life, which can identify with perfect accuracy which ones are slowly going to lose their mental capabilities. If your first instinct is, "We should outlaw this test" or at least "we should forbid employers from discriminating on the basis of this test," congratulations--you're a liberal. People should be judged on the basis of their actual, current abilities, not on the basis of what their spinal fluid indicates about what may happen some day. Tests can be wrong. [Italics added by me.]

By the time Kinsley reached the end of this passage, he seems to have forgotten that he had already stipulated that the test is 100% accurate. Make up your mind, man!

Also, what's that bit about "congratulations, you're a liberal"? I think there are conservatives who believe that "people should be judged on the basis of their actual, current abilities." Don't forget that over 70% of Americans support laws prohibiting employment discrimination on the basis of sexual orientation. I don't think all these people are liberals. Lots of people of all persuasions believe people should be judged based on what they can do, not who they are.

We're always hearing about the problems caused by political polarization, and I think this is an example. Medical diagnostics are tough enough without trying to align them on a liberal-conservative scale.

P.S Kaiser has more on that "100% accuracy" claim.

Yet another Bayesian job opportunity

Steve Cohen writes:

My [Cohen's] firm is looking for strong candidates to help us in developing software and analyzing data using Bayesian methods.

We have been developing a suite of programs in C++ which allow us to do Bayesian hierarchical regression and logit/probit models on marketing data. These efforts have included the use of high performance computing tools like nVidia's CUDA and the new OpenCL standard, which allow parallel processing of Bayesian models. Our software is very, very fast - even on databases that are ½ terabyte in size. The software still needs many additions and improvements and a person with the right skill set will have the chance to make a significant contribution.

Here's the job description he sent:

Kaggle forcasting update

Anthony Goldbloom writes:

The Elo rating system is now in 47th position (team Elo Benchmark on the leaderboard). Team Intuition submitted using Microsoft's Trueskill rating system - Intuition is in 38th position.

And for the tourism forecasting competition, the best submission is doing better than the threshold for publication in the International Journal of Forecasting.

Frank Wood and Nick Bartlett write:

Deplump works the same as all probabilistic lossless compressors. A datastream is fed one observation at a time into a predictor which emits both the data stream and predictions about what the next observation in the stream should be for every observation. An encoder takes this output and produces a compressed stream which can be piped over a network or to a file. A receiver then takes this stream and decompresses it by doing everything in reverse. In order to ensure that the decoder has the same information available to it that the encoder had when compressing the stream, the decoded datastream is both emitted and directed to another predictor. This second predictor's job is to produce exactly the same predictions as the initial predictor so that the decoder has the same information at every step of the process as the encoder did.

The difference between probabilistic lossless compressors is in the prediction engine, encoding and decoding being "solved" optimally already.

Deplump compression technology is built on a probabilistic discrete sequence predictor called the sequence memoizer. The sequence memoizer has been demonstrated to be a very good predictor for discrete sequences. The advantage deplump demonstrates in comparison to other general purpose lossless compressors is largely attributable to the better guesses made by the sequence memoizer.

Deplump is algorithmically quite closely related to infinite context prediction by partial matching (PPM) although it has differences and advantages which derive from being grounded on a coherent probabilistic predictive model.

I don't know anything about this, but it looks interesting to me. They also have a cool website where you can compress your own files. According to Frank, it gives you an compressed file that's quite a bit smaller than what you get from gzip.

Visualization magazine

Aleks pointed me to this.

I like what Antony Unwin has to say here (start on page 5).

In discussing the ongoing Los Angeles Times series on teacher effectiveness, Alex Tabarrok and I both were impressed that the newspaper was reporting results on individual teachers, moving beyond the general research findings ("teachers matter," "KIPP really works, but it requires several extra hours in the school day," and so forth) that we usually see from value-added analyses in education. My first reaction was that the L.A. Times could get away with this because, unlike academic researchers, they can do whatever they want as long as they don't break the law. They don't have to answer to an Institutional Review Board.

(By referring to this study by its publication outlet rather than its authors, I'm violating my usual rule (see the last paragraph here). In this case, I think it's ok to refer to the "L.A. Times study" because what's notable is not the analysis (thorough as it may be) but how it is being reported.)

Here I'd like to highlight a few other things came up in our blog discussion, and then I'll paste in a long and informative comment sent to me by David Huelsbeck.

But first some background.

Mister P gets married

Jeff, Justin, and I write:

Gay marriage is not going away as a highly emotional, contested issue. Proposition 8, the California ballot measure that bans same-sex marriage, has seen to that, as it winds its way through the federal courts. But perhaps the public has reached a turning point.

And check out the (mildly) dynamic graphics. The picture below is ok but for the full effect you have to click through and play the movie.

map5.png

Busted!

I'm just glad that universities don't sanction professors for publishing false theorems.

If the guy really is nailed by the feds for fraud, I hope they don't throw him in prison. In general, prison time seems like a brutal, expensive, and inefficient way to punish people. I'd prefer if the government just took 95% of his salary for several years, made him do community service (cleaning equipment at the local sewage treatment plant, perhaps; a lab scientist should be good at this sort of thing, no?), etc. If restriction of this dude's personal freedom is judged be part of the sentence, he could be given some sort of electronic tag that would send a message to the police if he were ever more than 3 miles from his home. But no need to bill the taxpayers for the cost of keeping him in prison.

Statoverflow

Skirant Vadali writes:

Alex Tabarrok reports on an analysis from the Los Angeles Times of teacher performance (as measured by so-called value-added analysis, which is basically compares teachers based on their students' average test scores at the end of the year, after controlling for pre-test scores.

It's well known that some teachers are much better than others, but, as Alex points out, what's striking about the L.A. Times study is that they are publishing the estimates for individual teachers. For example, this:

55545525.jpg

Nice graphics, too.

Why I blog?

There is sometimes a line of news, a thought or an article sufficiently aligned with the general topics on this blog that is worth sharing.

I could have emailed it to a few friends who are interested. Or I could have gone through the relative hassle of opening up the blog administration interface, cleaned it up a little, added some thoughts and made it pretty to post on the blog. And then it's poring through hundreds of spam messages, just to find two or three false positives in a thousand spams. Or, finding the links, ideas and comments reproduced on another blog without attribution or credit. Or, even, finding the whole blog mirrored on another website.

It might seem all work and no fun, but what keeps me coming back is your comments: the discussions, the additional links, information and insights you provide, this is what makes it all worthwhile.

Thanks, those of you who are commenters! And let us know what would make your life easier.

Republicans are much more likely than Democrats to think that Barack Obama is a Muslim and was born in Kenya. But why? People choose to be Republicans or Democrats because they prefer the policy or ideology of one party or another, and it's not obvious that there should be any connection whatsoever between those factors and their judgment of a factual matter such as Obama's religion or country of birth.

In fact, people on opposite sides of many issues, such as gay marriage, immigration policy, global warming, and continued U.S. presence in Iraq, tend to disagree, often by a huge amount, on factual matters such as whether the children of gay couples have more psychological problems than the children of straight couples, what are the economic impacts of illegal immigration, what is the effect of doubling carbon dioxide in the atmosphere, and so on.

Of course, it makes sense that people with different judgment of the facts would have different views on policies: if you think carbon dioxide doesn't cause substantial global warming, you'll be on the opposite side of the global warming debate from someone who thinks it does. But often the causality runs the other way: instead of choosing a policy that matches the facts, people choose to believe the facts that back up their values-driven policies. The issue about Obama's birth country is an extreme example: it's clear that people did not first decide whether Obama was born in the U.S., and then decide whether to vote Republican or Democratic. They are choosing their fact based on their values, not the other way around. Perhaps it is helpful to think of people as having an inappropriate prior distribution that makes them more likely to believe things that are aligned with their desires.

I think you knew this already

I was playing out a chess game from the newspaper and we reminded how the best players use the entire board in their game. In my own games (I'm not very good, I'm guessing my "rating" would be something like 1500?), the action always gets concentrated on one part of the board. Grandmaster games do get focused on particular squares of the board, of course, but, meanwhile, there are implications in other places and the action can suddenly shift.

Psychologists talk about "folk psychology": ideas that make sense to us about how people think and behave, even if these ideas are not accurate descriptions of reality. And physicists talk about "folk physics" (for example, the idea that a thrown ball falls in a straight line and then suddenly drops, rather than following an approximate parabola).

There's also "folk statistics." Some of the ideas of folk statistics are so strong that even educated people--even well-known researchers--can make these mistakes.

One of the ideas of folk statistics that bothers me a lot is what might be called the "either/or fallacy": the idea that if there are two possible stories, the truth has to be one or the other.

I have often encountered the either/or fallacy in Bayesian statistics, for example the vast literature on "model selection" or "variable selection" or "model averaging" in which it is assumed that one of some pre-specified discrete set of models is the truth, and that this true model can be determined from the data. Or, more generally, that the goal is to estimate the posterior probability of each of these models. As discussed in chapter 6 of BDA, in the application areas I've worked on, such discrete formulations don't make sense to me. Rather than saying that model A or model B might be true, I'd rather say they can both be true. Which is not the same as assigning, say, .3 probability to model A and .7 probability to model B; rather, I'm talking about a continuous model expansion that would include A and B as special cases. That said, any model I fit will have its limitations, so I recognize that discrete model averaging might be useful in practice. But I don't have to like it.

Since I've been primed to see it, I notice the either/or fallacy all over the place. For example, as I discuss here, cognitive scientist Steven Sloman writes:

A good politician will know who is motivated by greed and who is motivated by larger principles in order to discern how to solicit each one's vote when it is needed.

I can well believe that people think in this way but I don't buy it! Just about everyone is motivated by greed and by larger principles! This sort of discrete thinking doesn't seem to me to be at all realistic about how people behave--although it might very well be a good model about how people characterize others!

Later in his book on causal reasoning, Sloman writes:

No matter how many times A and B occur together, mere co-occurrence cannot reveal whether A causes B, or B causes A, or something else causes both. [italics added]

Again, I am bothered by this sort of discrete thinking. I'm not trying to pick on Sloman here; I'm just demonstrating how the either/or fallacy is so entrenched in our ideas of folk statistics that it comes out in all sorts of settings.

Most recently, I noticed the fallacy in the humble precincts of our blog, when, in response to Phil's remark that having lots of kids puts a strain on the environment, commenter A. Zarkov wrote,

Believe or not, some people really like children and want a lot of them. They think of each child as a blessing, not a strain on the bio-sphere.

That's the either/or fallacy again! As I see it, each child is a blessing and a strain on the biosphere. There's no reason to think it's just one or the other.

I'll stop now. I think you get the point.

DataMarket

It seems that every day brings a better system for exploring and sharing data on the Internet. From Iceland comes DataMarket. DataMarket is very good at visualizing individual datasets - with interaction and animation, although the "market" aspect hasn't yet been developed, and all access is free.

Here's an example of visualizing rankings of countries competing in WorldCup:

datamarket1.png

And here's a lovely example of visualizing population pyramids:


datamarket2.png

In the future, the visualizations will also include state of the art models for predicting and imputing missing data, and understanding the underlying mechanisms.

Other posts: InfoChimps, Future of Data Analysis

More forecasting competitions

Anthony Goldbloom from Kaggle writes:

We've recently put up some interesting new competitions. Last week, Jeff Sonas, the creator of the Chessmetrics rating system, launched a competition to find a chess rating algorithm that performs better than the official Elo system. Already nine teams have created systems that make more accurate predictions than Elo. It's not a surprise that Elo has been outdone - the system was invented half a century ago before we could easily crunch large amounts of historical data. However, it is a big surprise that Elo has been outperformed so quickly given that it is the product of many years' work (at least it was a surprise to me).

Rob Hyndman from Monash University has put up the first part of a tourism forecasting competition. This part requires participants to forecast the results of 518 different time series. Rob is the editor of the International Journal of Forecasting and has promised to invite the winner to contribute a discussion paper to the journal describing their methodology and giving their results (provided the winner achieves a certain level of predictive accuracy).

Finally the HIV competition recently ended. Chris Raimondi describes his winning method on the Kaggle blog.

Cool stuff. On the chess example, I'm not at all surprised that Elo has been outperformed. Published alternatives have been out there for years. We even have a chess example in Bayesian Data Analysis (in the first edition, from 1995), and that in turn is based on earlier work by Glickman.

I like this competition idea and would like to propose some ideas of our own, through the Applied Statistics Center. I'm thinking that if done right, this could be the basis of a Quantitative Methods in Social Sciences M.A. thesis. In any case, it would be a great way for students to get involved.

Deducer update

A year ago we blogged about Ian Fellows's R Gui called Deducer (oops, my bad, I meant to link to this).

Fellows sends in this update:

Matching at two levels

Steve Porter writes with a question about matching for inferences in a hierarchical data structure. I've never thought about this particular issue, but it seems potentially important.

Maybe one or more of you have some useful suggestions?

Porter writes:

Probability-processing hardware

Lyric Semiconductor posted:


For over 60 years, computers have been based on digital computing principles. Data is represented as bits (0s and 1s). Boolean logic gates perform operations on these bits. A processor steps through many of these operations serially in order to perform a function. However, today's most interesting problems are not at all suited to this approach.

Here at Lyric Semiconductor, we are redesigning information processing circuits from the ground up to natively process probabilities: from the gate circuits to the processor architecture to the programming language. As a result, many applications that today require a thousand conventional processors will soon run in just one Lyric processor, providing 1,000x efficiencies in cost, power, and size.

Om Malik has some more information, also relating to the team and the business.

The fundamental idea is that computing architectures work deterministically, even though the world is fundamentally stochastic. In a lot of statistical processing, especially in Bayesian statistics, we take stochastic world, force it into determinism, simulate stochastic world by computationally generating deterministic pseudo-random numbers, and simulate stochastic matching by deterministic likelihood computations. What Lyric could do is to bypass this highly inefficient intermediate deterministic step. This way, we'll be able to fit bigger and better models much faster.

They're also working on a programming language: PSBL (Probability Synthesis for Bayesian Logic), but there are no details. Here is their patent for Analog Logic Automata, indicating applications for images (filtering, recognition, etc.).

[D+1: J.J. Hayes points to a US Patent indicating that one of the circuits optimizes the sum-product belief propagation algorithm. This type of algorithms is popular in machine learning for various recognition and denoising problems. One way to explain it to a statistician is that it does imputation with an underlying loglinear model.]

José Iparraguirre writes:

There's a letter in the latest issue of The Economist (July 31st) signed by Sir Richard Branson (Virgin), Michael Masters (Masters Capital Management) and David Frenk (Better Markets) about an ">OECD report on speculation and the prices of commodities, which includes the following: "The report uses a Granger causality test to measure the relationship between the level of commodities futures contracts held by swap dealers, and the prices of those commodities. Granger tests, however, are of dubious applicability to extremely volatile variables like commodities prices."

The report says:

Granger causality is a standard statistical technique for determining whether one time series is useful in forecasting another. It is important to bear in mind that the term causality is used in a statistical sense, and not in a philosophical one of structural causation. More precisely a variable A is said to Granger cause B if knowing the time paths of B and A together improve the forecast of B based on its own time path, thus providing a measure of incremental predictability. In our case the time series of interest are market measures of returns, implied volatility, and realized volatility, or variable B. . . . Simply put, Granger's test asks the question: Can past values of trader positions be used to predict either market returns or volatility?

This seems clear enough, but the authors muddy the water later on by writing:

There is a positive contemporaneous association between changes in net positions held by index traders and price changes (returns) in the CBOT wheat market . . . this contemporaneous analysis cannot distinguish between the increase in index traders' positions and other correlated shifts in fundamentals: correlation does not imply causation. [Italics added by me.]

This seems to miss the point. Granger causality, as defined above, is a measure of correlation, or of partial correlation. It's just a correlation between things that are not happening at the same time. The distinction here is in what's being correlated. The phrase "correlation does not imply causation" does not belong here at all! (Unless I'm missing something, which is always possible.)

I have nothing to say on the particulars, as I have no particular expertise in this area. But in general, I'd prefer if researchers in this sort of problem were to try to estimate the effects of interest (for example, the amount of additional information present in some forecast) rather than setting up a series of hypothesis tests. The trouble with tests is that when they reject, it often tells us nothing more than that the sample size is large. And when they fail to reject, if often tells us nothing more than that the sample size is small. In neither case is the test anything like a direct response to the substantive question of interest.

EdLab at Columbia's Teachers' College

According to Kaiser:

EdLab at Teachers' College does a lot of interesting things, like creating technologies for the classroom and libraries, blogging, and analyzing data sets in the education sector.

They're 2 blocks from my office and I've never heard of them! And I even work with people at Teachers College. Columbia's a big place.

P.S. Kaiser also makes an excellent point:

The most intriguing and unexpected question was: to do well in this business, do you have to read a lot? This is where I stumbled into a spaghetti carbonara analogy while mixing metaphors with the gray flannel, with which I have already been associated. Basically, statistics is not pure mathematics, there is not one correct way of doing things, there are many different methodologies, like there are hundreds of recipes for making carbonara. What statisticians do is to try many different recipes (methods), and based on tasting the food (evaluating the outcomes), we determine which recipe to use. Because of this, statisticians need to be well-read, to keep up with what are the new methods being developed.

This is actually the kind of thing that I say--complete with a cooking example!--except that in this case it's his idea and not mine.

Some recent blog comments made me rethink how to express disagreement when I write. I'll first display my original blog entry, then some of the comments, then my reaction, and finally my new approach. As usual with negative comments, my first reaction was to be upset, but once the hurt feelings went away, I realized that these dudes had a point.

Act 1

A few days I ago, I posted the following on 538:

Self-described "political operative" Les Francis, with real-world experience as former executive director of the Democratic National Committee:
I don't need any polls to tell me that Republicans will do well in November. The "out" party almost always shows significant gains in the first midterm election of a new President.

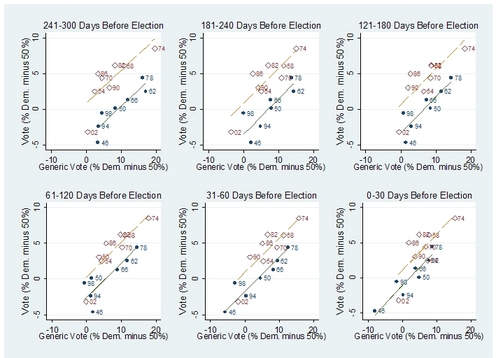
Political scientists Joe Bafumi, Bob Erikson, and Chris Wlezien, from elite, out-of-touch, ivory-tower institutions Dartmouth, Columbia, and Temple Universities:

congpolls2.jpg

Game over.

Act 2

After posting, I typically check the comments because sometimes I have some typos or obscure points that I need to fix or explain. The comments at 538 aren't always so polite, but this time they went over the top:

Otto said...

Maybe I'm just a poor country lawyer but I don't understand this post or what those graphs are supposed to say. Is the point that the President's party doesn't actually do poorly in midterms?

Also, I think the author is being sarcastic when he refers to those colleges as being ivory towers but it's tough to tell.

benh57 said...

I concur with Otto. Huh?

bigbadbutt said...

Yeah, as far as i can tell, both articles agree. Not sure what you're trying to imply here..

Bram Reichbaum said...

If the contest is whether political consultants or political operatives are more intelligible, game over indeed. [insert Marvin the Martian voice] This post makes me very angry. [/MMv]

And so on. You get the point. The commenters really, really hated it, and nobody got the point of the graphs.

Act 3

When Does a Name Become Androgynous?

Good stuff, as always, from Laura Wattenberg.

A few months ago I questioned Dan Ariely's belief that Google is the voice of the people by reporting the following bizarre options that Google gave to complete the simplest search I could think of:

Arnold Zellner

Steve Ziliak reports:

I [Ziliak] am sorry to share this sad news about Arnold Zellner (AEA Distinguished Fellow, 2002, ASA President, 1991, ISBA co-founding president, all around genius and sweet fellow), who died yesterday morning (August 11, 2010). He was a truly great statistician and to me and to many others a generous and wonderful friend, colleague, and hero. I will miss him.

His cancer was spreading everywhere though you wouldn't know it as his energy level was Arnold's typical: abnormally high. But then he had a stroke just a few days after an unsuccessful surgery "to help with breathing" the doctor said, and the combination of events weakened him terribly. He was vibrant through June and much of July, and maintained an 8 hour work day at the office. He never lost his sense of humor nor his joy of life. He died at home in hospice care and fortunately he did not suffer long.

From the official announcement from the University of Chicago:

Arnold began his academic career in 1955 at the University of Washington, Seattle, then moved to the University of Wisconsin, Madison. In 1966 he joined the faculty of Chicago Booth and remained on our faculty until his retirement in 1996.

Arnold pioneered the field of Bayesian econometrics and was highly regarded by colleagues in his field. He founded the International Society of Bayesian Analysis, served in numerous leadership roles of the American Statistical Association, and received several honorary degrees. His teaching also was recognized by the McKinsey Award for Excellence in Teaching. He remained active after his retirement, continuing to do research, publish papers, and serve as a mentor to students.

Arnold was a distinguished researcher, award-winning teacher, and wonderful colleague. His friendly greeting and gracious manner will be missed. We are fortunate to have had someone as remarkable both professionally and personally as Arnold be a member of our community for so many years. His legacy reminds us what makes this institution such a special place.

Zellner was an old-school Bayesian, focusing on statistical models rather than philosophy. He also straddled the fields of statistics and econometrics, which makes me think of some similarities and differences between these sister disciplines.

To a statistician such as myself, econometrics seems to have two different, nearly opposing, personalities. On one side, econometrics is the study of physics-like laws--supply and demand, utility theory, simultaneous equation models, all sorts of attempts to capture economic behavior with mathematical laws. More recently, some of this focus has moved to agent-based modeling, but it's still the same basic idea to me: serious mathematical modeling. The data are there to understand the fundamental underlying economic processes.

But there's another side to economics, a side that I think has become much more prominent, and that's the anti-modeling approach, the distribution-free methods that try to assume as little as possible (replacing distributional assumptions by second-order stationarity, etc.) to be able to make forecasting or causal claims as robustly as possible.

To the extent that economics is a model-centered field, I think it's naturally Bayesian, and Zellner's methods fit in well. To the extent that economists are interested in robust, non-model-based population inference, I think Bayesian methods are also important--nonparametric methods get complicated quickly, and Bayesian inference is a good way to structure that complexity.

Unfortunately, Bayesian methods have a bad name in some quarters of econometrics because they are associated with subjectivity, which goes against both mainstream threads in econometrics. Whether you're doing physics-influenced modeling or statistics-influenced nonparametrics, you want your inferences to be objective as possible. So both kinds of econometricans can agree to disdain Bayes.

What Zellner showed in his work was how Bayesian methods could be objective, and statistically efficient, and solve problems in econometrics. This was, and is, important.

P.S. I only met Zellner a few times and did not know him personally. My only Zellner story comes from the famous conference at Ohio State University in 1991 on Bayesian Computation via Stochastic Simulation. At one point near the end of the meeting, Zellner stood up and said: Hearing all this important work makes me (Zellner) realize we need to start a crash research program on these methods. And you know what they say about crash research programs. It's like trying to create a baby by getting nine women pregnant and waiting one month. (pause) It might not work, but you'll have a hell of a time trying. (followed by complete stunned silence)

The other thing I remember about Zellner was his statistics seminar at the business school, which I attended a few times during my semester visiting the University of Chigago. No matter who the speaker was, Zeller was always interrupting, asking questions, giving his own views. Not in that aggressive econ-seminar style that we all know and hate; rather Zeller always gave the impression of being a participant in his seminar, one among many who just had the privilege of being able to speak whenever he had a thought--which was often. He was lucky to have the chance to express his statistical thoughts in many venues, and we as a field were lucky to be there to hear him.

Indiemapper makes thematic mapping easy

Arthur Breitman writes:

I had to forward this to you when I read about it...

My reply: Interesting; thanks. Things like this make me feel so computer-incompetent! The younger generation is passing me by...

Are all rich people now liberals?

So asks James Ledbetter in Slate.

And the answer is . . . No!

Here's what happened in 2008:

pewincome2.png

OK, that's how people vote. How bout party identification and ideology? Check these out:

pidideology.png
(Click on image to see larger version.)

And here it is, sliced a different way:

pidideology2000_groupedSpaced.png

Of, if you want to see it in map form, check out this article (with Daniel and Yair).

P.S. A skeptic might comment that the above graphs, which are based on national poll data, only break down incomes to the top 5% or so. What about the truly rich. Here are my thoughts on the political attitudes of the super-rich.

P.P.S. Ledbetter actually makes some good points in his article, which is about the campaign contributions of rich Americans. The article relies on a recent book by David Callahan, which seems to echo the work of Tom Ferguson (cited in the above-linked blog entry), who's tracked campaign contributions by industry over many years.

I think that Ferguson (and Callahan) are on to something important, and I'm glad that Ledbetter is thinking about the implications of these trends. I just think his headline is silly and unhelpful. And the fact that it got out there at all--I assume Ledbetter didn't write the headline himself--is evidence that there is still a lot of confusion about income and voting in the news media.

John McPhee, the Anti-Malcolm

This blog is threatening to turn into Statistical Modeling, Causal Inference, Social Science, and Literature Criticism, but I'm just going to go with the conversational flow, so here's another post about an essayist.

I'm not a big fan of Janet Malcolm's essays --- and I don't mean I don't like her attitude or her pro-murderer attitude, I mean I don't like them all that much as writing. They're fine, I read them, they don't bore me, but I certainly don't think she's "our" best essayist. But that's not a debate I want to have right now, and if I did I'm quite sure most of you wouldn't want to read it anyway. So instead, I'll just say something about John McPhee.

As all right-thinking people agree, in McPhee's long career he has written two kinds of books: good, short books, and bad, long books. (He has also written many New Yorker essays, and perhaps other essays for other magazines too; most of these are good, although I haven't seen any really good recent work from him, and some of it has been really bad, by his standards). But...

Via J. Robert Lennon, I discovered this amusing blog by Anis Shivani on "The 15 Most Overrated Contemporary American Writers."

Lennon found it so annoying that he refused to even link to it, but I actually enjoyed Shivani's bit of performance art. The literary criticism I see is so focused on individual books that it's refreshing to see someone take on an entire author's career in a single paragraph. I agree with Lennon that Shivani's blog doesn't have much content--it's full of terms such as "vacuity" and "pap," compared to which "trendy" and "fashionable" are precision instruments--but Shivani covers a lot of ground and it's fun to see this all in one place.

My main complaint with Shivani, beyond his sloppy writing (but, hey, it's just a blog; I'm sure he saves the good stuff for his paid gigs) is his implicit assumption that everyone should agree with him. I'm as big a Kazin fan as anyone, but I still think he completely undervalued Marquand.

The other thing I noticed was that, apart from Amy Tan and Jhumpa Lahiri, none of the writers on Shivani's list were people whom I would consider bigshots. To me, they seemed like a mix of obscure poets (even a famous poet within the poetry-and-NPR world is still obscure compared to other kinds of writers), obscure critics (ditto), and some Manhattan-insider types. And Junot Diaz, who I like, even if maybe Shivani is right that he's just riffing on old Philip Roth shtick.

P.S. Following the links from Shivani, I came across this. I still think Andrea did it better, though.

P.P.S. Shivani mentioned "Antonya Nelson." The name rang a bell, so I searched the blog and found this. She's the one who wrote the John Updike story! ("Not angry enough to be a John Cheever story, not clipped enough to be a Raymond Carver story, not smooth enough to be a Richard Ford story.") I'm surprised Shivani didn't mention that one.

P.P.P.S. Thinking a bit more about Lennon's reaction . . . I guess I'd be pretty annoyed to see an article on "the 15 most overrated American statisticians." I know two or three people who'd probably put me high on such a list. It's a good thing they don't have blogs!

George Leckie writes:

The Centre for Multilevel Modelling is seeking to appoint two social statisticians or social scientists with advanced quantitative skills for two ESRC-funded research projects:

1. Research Assistant in Social Statistics, 1 year from 1 October 2010

2. Research Assistant/Associate in Social Statistics, 34 months from 1 October 2010.

Multilevel modeling in R on a Mac

Peter Goff wrote:

Note to semi-spammers

I just deleted another comment that seemed reasonable but was attached to an advertisement.

Here's a note to all of you advertisers out there: If you want to leave a comment on this site, please do so without the link to your website on search engine optimization or whatever. Or else it will get deleted. Which means you were wasting your time in writing the comment.

I want your comments and I don't want you to waste your time. So please just stop already with the links, and we'll both be happier.

P.S. Don't worry, you're still not as bad as the journal Nature (see the P.S. here).

I dodged a bullet the other day, blogorifically speaking. This is a (moderately) long story but there's a payoff at the end for those of you who are interested in forecasting or understanding voting and public opinion at the state level.

Act 1

It started when Jeff Lax made this comment on his recent blog entry:

Nebraska Is All That Counts for a Party-Bucking Nelson

Dem Senator On Blowback From His Opposition To Kagan: 'Are They From Nebraska? Then I Don't Care'

Fine, but 62% of Nebraskans with an opinion favor confirmation... 91% of Democrats, 39% of Republicans, and 61% of Independents. So I guess he only cares about Republican Nebraskans...

I conferred with Jeff and then wrote the following entry for fivethirtyeight.com. There was a backlog of posts at 538 at the time, so I set it on delay to appear the following morning.

Here's my post (which I ended up deleting before it ever appeared):

The last great essayist?

I recently read a bizarre article by Janet Malcolm on a murder trial in NYC. What threw me about the article was that the story was utterly commonplace (by the standards of today's headlines): divorced mom kills ex-husband in a custody dispute over their four-year-old daughter. The only interesting features were (a) the wife was a doctor and the husband were a dentist, the sort of people you'd expect to sue rather than slay, and (b) the wife hired a hitman from within the insular immigrant community that she (and her husband) belonged to. But, really, neither of these was much of a twist.

To add to the non-storyness of it all, there were no other suspects, the evidence against the wife and the hitman was overwhelming, and even the high-paid defense lawyers didn't seem to be making much of an effort to convince anyone of their client's innocents. (One of the closing arguments was that one aspect of the wife's story was so ridiculous that it had to be true. In the lawyer's words:

If she was guilty, why would she say that? . . . It's actually the strongest evidence of her truthfulness, because if she was a liar she would say something that made no sense. I mean, it makes no sense.

If that's the "strongest evidence" in your favor, then you're in trouble.)

And indeed, the two defendants were in trouble. They ended up with life in prison.

The only real evidence in favor of the defendants was that the woman was devoted to her daughter and that she and her husband (and their extended families as well) were involved in bitter legal proceedings, which included at one point a court order against the husband and, at a later date, a ruling that he should have custody of the daughter. Unfortunately, all of this understandable frustration did nothing to reduce the evidence that she hired her friend to kill her ex-husband. If anything, this all just makes the motivation for the murder that much more plausible.

The strange thing about the Janet Malcolm article is that Malcolm is so sympathetic to the killers (or, more specifically, to the ex-wife who made the call; Malcolm doesn't say much about the actual shooter). Malcolm never goes so far as to do a Michael Moore (who notoriously described himself as the only white man in America who thought O. J. Simpson didn't do it), but she definitely seemed to be rooting for the woman to get off, to the extent that she (Malcolm) called up one of the lawyers in the middle of the trial in what looks like an attempt to force a mistrial.

Malcolm's main argument seems to be that the woman who ordered the killing was represented by a very good lawyer, but, because of difficulties having to do with other lawyers involved in the case, this super-defender didn't have a chance to really do his thing and win the case.

Why do I care?

Why am I writing hundreds of words about a months-old magazine article on a year-old court case that wasn't so remarkable in the first place?

The key is the author: Janet Malcolm, who's arguably the best--perhaps only--pure essayist writing in English today.

What do I mean by a "pure essayist"? Someone who writes about one topic but is using it as a hook to talk about . . . anything and everything. Classic examples from the previous century include Rebecca West and the George Orwell of "Inside the Whale." Who else besides Janet Malcolm does this nowadays?

To understand any article by Malcolm, you have to go on several levels.

1. On the surface, it's the story of a woman in a difficult situation (an immigrant woman, a doctor, divorced with a young child and trapped in a family feud) who's been accused of murder, and, as the story goes on, it becomes pretty clear that she actually did it. Along with this, it's an interesting look into the peculiarities of the court system, from jury selection through cross-examination to opening arguments.

2. At the next level, it's a New Journalism-style bit of court reporting, where we are told not just about the facts of the case but also, "Boys on the Bus"-style, about the other reporters and about the journalist's personal sympathies.

3. Finally, amidst the colorful details of the court case, Malcolm occasionally offers a thoughtful reflection on the court system. Sometimes I think she's flat-out wrong, but even then she's interesting. (For example, at one point she reports an awkward bit of cross-examination and says that witnesses often get tangled up in trying to match wits with opposing lawyers. My impression is that the story is simpler than that, it's just that when you're on the stand, you're scared of saying the wrong thing, so your words come out all hesitant, defensive, and triple-checked. How can anyone avoid it?) Anyway, the point is that I found Malcolm's article to be thought-provoking throughout, much more than one would expect from the pretty basic story of the crime.

OK, here's my theory . . .

Now let's try to put it all together. What we have is an open-and-shut case, a story with no suspense. The killer is named on page 1 and the evidence mounts from there. No courtroom surprises, the case ends as it begins, and the killers get life sentences. I don't think that any major magazine--other than the New Yorker--would've published Malcolm's article.

So why did Malcolm take on this case? One possibility is that it seemed more ambiguous at the beginning than the end. Perhaps before the trial started, the evidence didn't look as strong as it eventually did. (Once Malcolm sat in the trial for several weeks and interviewed all the participants, it's no surprise that she turned it into an article (and maybe, soon, into a book); the real question is why she thought this particular case was worse the effort in the first place.)

I have a theory. I doubt I'll ever have the chance to meet Janet Malcolm and ask her, so I'll just put it out here. Malcolm refers to the well-known idea that all sorts of lawyers can successfully defend an innocent person; what makes a great defense lawyer is the ability to get a guilty person off. And, indeed, if there's a hero in Malcolm's story, it's the lawyer for the ex-wife, a man who perhaps can work miracles.

So, my theory is that Malcolm sees herself in the same role. Any journalist can wring sympathy and a critique of the legal system out of a wrongly-accused person, but a great journalist can extract sympathy from someone who's manifestly guilty.

Thus, rather than writing an article slamming the criminal courts on the basis of some dramatic miscarriage of justice, Malcolm is attempting the much more impressive feat of basing her critique on an open-and-shut case.

What I'm talking about here is not just a degree-of-difficulty thing. My guess is that Malcolm feels that her deeper arguments are strong enough that they should hold even in the weakest-possible legal case. Perhaps Malcolm would feel it would be cheating to make her argument in the context of an innocent person wrongly accused, or even in an ambiguous case.

This reminds me of Malcolm's most famous article, The Journalist and the Murderer, in which--incredibly (to me)--she was angry at a journalist for deceiving a man who, it turned out, had murdered his entire family! Again, I think Malcolm saw the challenge in taking the side of a murderer, and, again, she felt strongly enough about her point (that journalists should not be deceivers) that she wanted to make that point in the starkest possible setting. The Journalist and the Murderer: you can't get much starker than that.

In any case, I wasn't convinced by Malcolm's article. Just because there are some awesome lawyers out there, no, I don't think every killer has the right to Johnny-Cochran-level representation. And, no matter how much someone loves their child, I don't see that it's such a great idea to arrange for the child to see her father being shot. It's hard for me to get around this one. I also don't approve of a journalist trying to use her influence to throw a monkey wrench into a murder trial.

But Malcolm's our only great essayist, so I'll read through to see her thoughts. I can appreciate a writer's artistry without agreeing with her politics.

The U.S. as welfare state

My Columbia colleague Irv Garfinkel recently came out with a book (with coauthors Lee Rainwater and Timothy Smeeding), "Mythbusters: The U.S. Social Welfare State," where they argue:

The United States is a capitalist nation that has eschewed Scandinavian-style socialist policies in favor of capitalism and economic growth, right? Wrong. The U.S. is not only one of the largest welfare states in the world, but it is strong economically precisely because of its adoption of some socialist policies--with public education as the primary driver.

The American welfare state faces large challenges. Restoring its historical lead in education is the most important but requires investing large sums in education--beginning with universal pre-school--and in complementary programs--including selected cash benefits for families with children--that aid children's development. The American health insurance system is by far the most costly in the rich world, yet fails to insure one sixth of its population, produces below average results, crowds out useful investments in children, and is the least equitably financed. Achieving universal coverage, which will be nearly accomplished by the recently passed health care legislation, will increase costs but long term costs can be restrained with complete government financing. Such reforms are possible - and will make the U.S. a leader again in both commitment to the social welfare state and a productive, market-based economy.

I haven't actually seen the book so I don't know the details backing up their argument, but Irv has always been pretty close to the data so I expect the book is worth a careful look.

President Carter

This assessment by Tyler Cowen reminded me that, in 1980, I and just about all my friends hated Jimmy Carter. Most of us much preferred him to Reagan but still hated Carter. I wouldn't associate this with any particular ideological feeling--it's not that we thought he was too liberal, or too conservative. He just seemed completely ineffectual. I remember feeling at the time that he had no principles, that he'd do anything to get elected.

In retrospect, I think of this as an instance of uniform partisan swing: the president was unpopular nationally, and attitudes about him were negative, relatively speaking, among just about every group.

My other Carter story comes from a conversation I had a couple years ago with an economist who's about my age, a man who said that one reason he and his family moved from town A to town B in his metropolitan area was that, in town B, they didn't feel like they were the only Republicans on their block.

Anyway, this guy described himself as a "Jimmy Carter Republican."

Me: You mean you liked Carter's policies on deregulation?

Him: No. I mean that Jimmy Carter made me a Republican.

Data Visualization

A great new blog-class by Shawn Allen at Data Visualization, assembling all the good stuff in one place.

Besag

Xian posts his memories of Julian Besag, who is perhaps most famous for publishing the Hammersley-Clifford theorem (see here for some background). I met Besag in 1989 when I spoke at the University of Washington; also I have a memory of a conference in 1992 or 1993, I think it was, when he objected strongly to my use of the chi-squared test to check the fit of a Bayesian model. (In retrospect, I don't think I presented my ideas clearly enough; some of the material in that talk ended up in this article with Meng and Stern.) I also recall a talk I gave in Seattle around 1996, when Besag commented that the models I was using for spatial analysis were pretty crude--a fair comment, actually. I don't actually recall any of Besag's lectures, but I read many of his papers. As Xian said, Besag did innovative and important work on spatial statistics, work that will be long used and remembered. He was in many ways ahead of his time and was a rarity in his generation of Bayesian statisticians in being motivated by models and applications rather than by theory.

Turning pages into data

There is a lot of data on the web, meant to be looked at by people, but how do you turn it into a spreadsheet people could actually analyze statistically?

The technique to turn web pages intended for people into structured data sets intended for computers is called "screen scraping." It has just been made easier with a wiki/community http://scraperwiki.com/.

They provide libraries to extract information from PDF, Excel files, to automatically fill in forms and similar. Moreover, the community aspect of it should allow researchers doing similar things to get connected. It's very good. Here's an example of scraping road accident data or port of London ship arrivals.

You can already find collections of structured data online, examples are Infochimps ("find the world's data"), and Freebase ("An entity graph of people, places and things, built by a community that loves open data."). There's also a repository system for data, TheData ("An open-source application for publishing, citing and discovering research data").

The challenge is how to keep these efforts alive and active. One early company helping people screen-scrape was Dapper that's now helping retailers advertise by scraping their own websites. Perhaps the library funding should be used towards tools like that rather than piling up physical copies of expensive journals everyone reads just online.

Some earlier posts on this topic [1], [2].

Angry about the soda tax

My Columbia colleague Sheena Iyengar (most famous among ARM readers for her speed-dating experiment) writes an interesting column on potential reactions to a tax on sugary drinks. The idea is that people might be so annoyed at being told what to do that they might buy more of the stuff, at least in the short term.

On the other hand, given the famous subsidies involved in the production of high-fructose corn syrup, soda pop is probably a bit cheaper than it should be, so maybe it all balances out?

I agree with Sheena that there's something about loss of control that is particularly frustrating. One thing that bugs me when I buy a Coke is that I'm paying for the fees of Michael Jordan or whoever it is they have nowadays endorsing their product. I wish there were some way I could just pay for everything else but withhold the money that's going into those silly celebrity endorsements.

See paragraphs 13-15 of this article by Dan Balz.

Fascinating interview by Kathryn Schulz of Google research director Peter Norvig. Lots of stuff about statistical design and analysis.

Tyler Cowen links to an interesting article by Terry Teachout on David Mamet's political conservatism. I don't think of playwrights as gurus, but I do find it interesting to consider the political orientations of authors and celebrities.

I have only one problem with Teachout's thought-provoking article. He writes:

As early as 2002 . . . Arguing that "the Western press [had] embraced antisemitism as the new black," Mamet drew a sharp contrast between that trendy distaste for Jews and the harsh realities of daily life in Israel . . .

In 2006, Mamet published a collection of essays called The Wicked Son: Anti-Semitism, Jewish Self-Hatred and the Jews that made the point even more bluntly. "The Jewish State," he wrote, "has offered the Arab world peace since 1948; it has received war, and slaughter, and the rhetoric of annihilation." He went on to argue that secularized Jews who "reject their birthright of 'connection to the Divine'" succumb in time to a self-hatred that renders them incapable of effectively opposing the murderous anti-Semitism of their enemies--and, by extension, the enemies of Israel.

It is hard to imagine a less fashionable way of framing the debate over Israel, and even the most sympathetic reviewers of The Wicked Son frequently responded with sniffish dismay to Mamet's line of argument. . . .

I added the boldface above.

Setting aside the specific claims being made here (it would be hard for me to evaluate, for example, whether antisemitism was indeed "trendy" in 2002), I think Teachout made a mistake in his use of "trendy" and "fashionable." What do those words mean, really? As far as I can tell, they are used to refer to a position that you disagree with but that you fear is becoming more popular. Or, to put it another way, everything's trendy until it jumps the shark.

So far, it might sound like I'm making a picky comment about English usage, along the lines of my recommendations to academic writers to avoid unnecessary phrases such as "Note that" and "obviously." "Trendy" and "fashionable" are convenient negative words that don't add much meaning--they're a way to express contempt without taking the trouble to make an actual argument.

But it goes beyond that. My real trouble with the use of "fashionable" and "trendy" (and the accompanying implicit reasoning that goes along with them) is that they can get a writer tangled up in contradictions, without him even realizing it.

Let's return to the article under discussion. After praising him for his "less fashionable" framing of the debate over Israel, Teachout turns to Mamet's latest play, which he does not actually like very much: "Alas, his first post-conversion play does not suggest that this new point of view has as yet borne interesting artistic fruit." Teachout concludes his mini-review with the following sentence (parentheses in the original):

(The play has, interestingly, proved to be a major success at the box office.)

Here's my problem. At this point, everything in Teachout's (and, perhaps, Mamet's) world is suffused with political implication. It's the good guys versus the bad guys. I can think of a few ways to interpret the parenthetical remark above:

- Theatergoers--unlike playwrights--are sensible Americans, middle-of-the-road politically, and welcome a fresh new play that does not take a politically-correct view of the world. This is a Hollywood-versus-America sort of argument and is consistent with the idea that we should trust the judgment of the market over that of a narrow spectrum of playwrights and critics.

- On the other hand, Teachout didn't actually like the play, so maybe he's making an opposite argument, that theatergoers are, essentially, nothing but sheep who flock to anything by a big-name playwright. This is consistent with the idea that theaters can get away with all sorts of politically-correct crap and the audience won't know the difference, thus a self-perpetuating mechanism that isolates theater away from the real life of America.

- Or maybe Teachout is simply saying that American theater has degenerated to such an extent that even "heavy-handed lectures"--this is how he describes Mamet's latest--can be major successes.

The judgment of the market is always a double-edged sword, and it's never clear whether popularity should be taken as a sign of virtue ("the free-market economy," in Mamet's words) or as a deplorable sign of conformity (recall those oh-so-trendy words, "trendy" and "fashionable").

Why did I write this?

I'm a Mamet fan--who isn't?--but I don't recall ever having seen any of his plays performed. And I'm not really familiar with Terry Teachout (although I recognized the distinctive name, and I think I've read a few other things by him, over the years).

So why did I write this? Because I think a lot about writing, and I find myself sensitive to turns of phrase that facilitate confusion in a writer. Sometimes confusions can be remedied by statistics (for example, the notorious claim that "people vote against their interests"), but in other cases, such as in Teachout's article, I think the problem is in a division of the world into good guys and bad guys. Here's another example from a few months ago, an article about demographic trends that, again, got tangled from a need (as I see it) to be both popular and unpopular at the same time--to have the perceived virtues of mass support while being an embattled underdog.

In the short term, perhaps we can all avoid the words "fashionable" and "trendy." Or, if they must be used, please explain how to distinguish a positive trend in opinion (a "trend," as it were) from a negative trend (which, of course, is just "trendy").

P.S. I'm not trying to pick on Teachout. It's only because I found his article interesting that I took the trouble to comment on this one bit. I just think his article (and similar musings on art and politics) could be improved by subtracting these two words, which are so easy to write but so destructive of clear thinking.

P.P.S. After posting the above, I corresponded briefly with Teachout . He was polite but refused to back down. Oh well, life wasn't meant to be easy, I guess.

Fake newspaper headlines

I used this convenient site to create some images for a talk I'm preparing. (The competing headlines: "Beautiful parents have more daughters" vs. "No compelling evidence that beautiful parents are more or less likely to have daughters." The latter gets cut off at "No compelling evidence that," which actually works pretty well to demonstrate the sort of dull headline that would result if newspapers were to publish null results.)

Nick Obradovich saw our graphs and regressions showing that the most popular governors tended to come from small states and suggested looking at unemployment rates. (I'd used change in per-capita income as my economic predictor, following the usual practice in political science.)

Here's the graph that got things started:

Governors Approval Rating 2009.png

And here's what Obradovich wrote:

It seems that average unemployment rate is more strongly negatively correlated with positive governor approval ratings than is population. The unemployment rate and state size is positively correlated.

Anyway, when I include state unemployment rate in the regressions, it pulls the significance away from state population. I do economic data work much of the day, so when I read your post this morning and looked at your charts, state unemployment rates jumped right out at me as a potential confound.

I passed this suggestion on to Hanfei, who ran some regressions:

lm (popularity ~ c.log.statepop + c.unemployment)
coef.est coef.se
(Intercept) 48.57 2.07
c.log.statepop -3.98 2.42
c.unemployment -2.95 1.20
---
n = 49, k = 3
residual sd = 14.46, R-Squared = 0.27

lm (popularity ~ c.log.statepop * c.unemployment)
coef.est coef.se
(Intercept) 47.50 2.31
c.log.statepop -3.90 2.42
c.unemployment -2.79 1.20
c.log.statepop:c.unemployment 1.09 1.06
---
n = 49, k = 4
residual sd = 14.45, R-Squared = 0.29

lm(formula = popularity ~ c.log.statepop + c.income.change + c.unemployment)
coef.est coef.se
(Intercept) 48.57 2.05
c.log.statepop -3.47 2.44
c.income.change 1.97 1.62
c.unemployment -2.76 1.20
---
n = 49, k = 4
residual sd = 14.38, R-Squared = 0.29

Also some other versions including lots of non-statistically-significant interactions. The "c" in the variables "c.log.statepop", "c.unemployment", etc., represent centering. We centered each predictor to allow easy interpretation of each main effect in the presence of interactions.

The punch line is that, in these models, state-level unemployment is highly predictive of lower popularity for the governor. Even after controlling for these economic predictors, governors of smaller states remain more popular, but this trend is no longer statistically significant.

The next step is to look at other years and other statewide offices. I think there are some articles on this in the political science literature that Shigeo found when we last looked at the topic.

In the meantime, I'll take the position that the most popular governors tend to be from smaller states, and some of this pattern appears to be explained by economic factors.

A neuroeconomist asks::

Is there any literature on the Bayesian approach to simultaneous equation systems that you could suggest? (Think demand/supply in econ).

My reply: I'm not up-to-date on the Bayesian econometrics literature. TTony Lancaster came out with a book a few years ago that might have some of these models. Maybe you, the commenters, have some suggestions? Measurement-error models are inherently Bayesian, seeing as they have all these latent parameters, so it seems like there should be a lot out there.

That half-Cauchy prior

Xiaoyu Qian writes:

Tyler Cowen asks the above question. I don't have a full answer, but, in the Economics section of A Quantitative Tour of the Social Sciences, Richard Clarida discusses in detail the ways that researchers have tried to estimate the extent to which government or private forecasts supply additional information.

From the classic Box, Hunter, and Hunter book. The point of the saying is pretty clear, I think: There are things you learn from perturbing a system that you'll never find out from any amount of passive observation. This is not always true--sometimes "nature" does the experiment for you--but I think it represents an important insight.

I'm currently writing (yet another) review article on causal inference and am planning use this quote.

P.S. I find it helpful to write these reviews for a similar reason that I like to blog on certain topics over and over, each time going a bit further (I hope) than the time before. Beyond the benefit of communicating my recommendations to new audiences, writing these sorts of reviews gives me an excuse to explore my thoughts in more rigor.

P.P.S. In the original version of this blog entry, I correctly attributed the quote to Box but I incorrectly remembered it as "No understanding without manipulation." Karl Broman (see comment below) gave me the correct reference.

Congressman Kevin Brady from Texas distributes this visualization of reformed health care in the US (click for a bigger picture):

obamacare.png

Here's a PDF at Brady's page, and a local copy of it.

Complexity has its costs. Beyond the cost of writing it, learning it, following it, there's also the cost of checking it. John Walker has some funny examples of what's hidden in the almost 8000 pages of IRS code.

Text mining and applied statistics will solve all that, hopefully. Anyone interested in developing a pork detection system for the legislation? Or an analysis of how much entropy to the legal code did each congressman contribute?

There are already spin detectors, that help you detect whether the writer is a Democrat ("stimulus", "health care") or a Republican ("deficit spending", "ObamaCare").

D+0.1: Jared Lander points to versions by Rep. Boehner and Robert Palmer.

As part of his continuing plan to sap etc etc., Aleks pointed me to an article by Max Miller reporting on a recommendation from Jacob Appel:

Adding trace amounts of lithium to the drinking water could limit suicides. . . . Communities with higher than average amounts of lithium in their drinking water had significantly lower suicide rates than communities with lower levels. Regions of Texas with lower lithium concentrations had an average suicide rate of 14.2 per 100,000 people, whereas those areas with naturally higher lithium levels had a dramatically lower suicide rate of 8.7 per 100,000. The highest levels in Texas (150 micrograms of lithium per liter of water) are only a thousandth of the minimum pharmaceutical dose, and have no known deleterious effects.

I don't know anything about this and am offering no judgment on it; I'm just passing it on. The research studies are here and here. I am skeptical, though, about this part of the argument:

  1 2 3 4 5 6 7 8 9 10 11 12 13 14 15 16 17 18 19 20 21 22 23 24 25 26 27 28 29 30 31 32 33 34 35 36 37 38 39 40 41 42 43 44 45 46 47 48  

Recent Comments

  • Kiers: another public argument using the olde 'it's in such trace read more
  • Jeremy Miles: Phil: Gosh, yes. I always thought they were different. Thanks. read more
  • Phil: Jeremy, the element lithium is the drug lithium. read more
  • fraac: Either it has an effect or it doesn't. Crazy talk. read more
  • Jeremy Miles: I think some people have got real confused. Lithium is read more
  • Phil: I once heard a friend admonish his son, whom he read more
  • PM: The P.P.S. is the (appropriately) cruelest thing I have seen read more
  • Andrew Gelman: Ken: Amusing. And I probably could've fit in a couple read more
  • Ken Williams: I had a stack overflow error on "how sure can read more

Find recent content on the main index or look in the archives to find all content.