This recently-published graph is misleading but also has the unintended benefit of revealing a data problem:
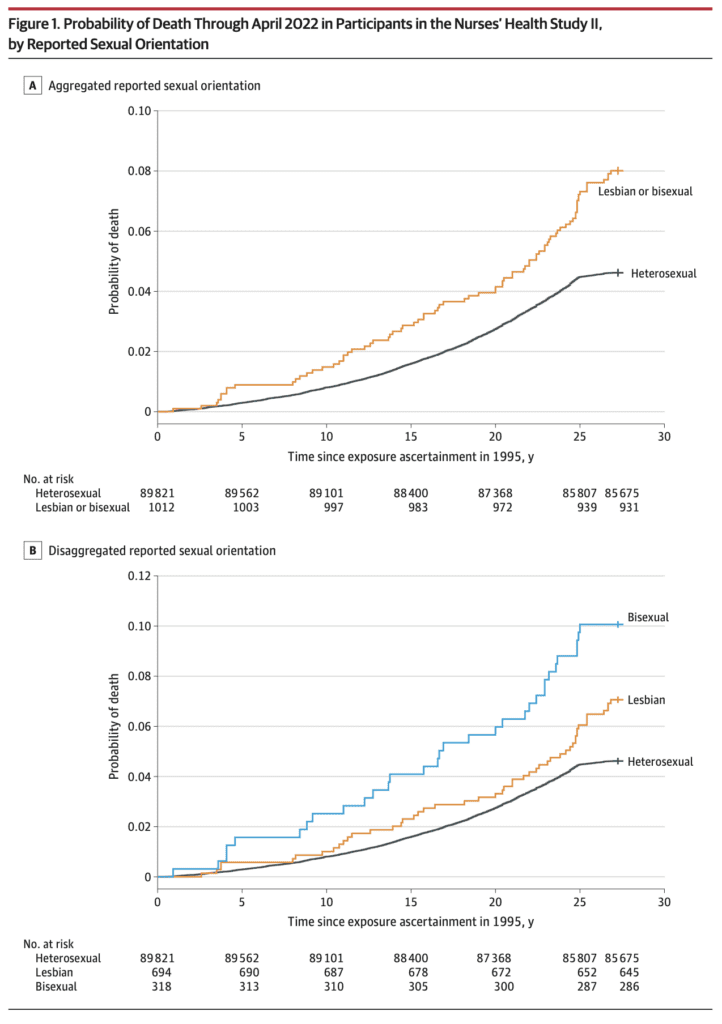
Jrc brought it up in a recent blog comment. The figure is from an article published in the Journal of the American Medical Association, which states:
This prospective cohort study examined differences in time to mortality across sexual orientation, adjusting for birth cohort. Participants were female nurses born between 1945 and 1964, initially recruited in the US in 1989 for the Nurses’ Health Study II, and followed up through April 2022. . . .
Compared with heterosexual participants, LGB participants had earlier mortality (adjusted acceleration factor, 0.74 [95% CI, 0.64-0.84]). These differences were greatest among bisexual participants (adjusted acceleration factor, 0.63 [95% CI, 0.51-0.78]) followed by lesbian participants (adjusted acceleration factor, 0.80 [95% CI, 0.68-0.95]).
The above graph tells the story. As some commenters noted, there’s something weird going on with the line for heterosexual women 25+ years after exposure assessment. I guess these are the deaths from 2020 until the end of data collection in 2022.
Maybe not all the deaths were recorded? I dunno, it looks kinda weird to me. Here’s what they say in the paper:
The linkages to the NDI [National Death Index] were confirmed through December 31, 2019; however, ongoing death follow-up (eg, via family communication that was not yet confirmed with the NDI) was assessed through April 30, 2022. In the sensitivity analyses, only NDI-confirmed deaths (ie, through December 31, 2019) were examined.
Given the problem in the above graph, I’m guessing we should just forget about the main results of the paper and just look at the estimates from the sensitivity analyses. They say that sexual orientation was missing for 22% of the participants.
Getting back to the data . . . Table 1 shows that the lesbian and bisexual women in the study were older, on average, and more likely to be smokers. So just based on that, you’d expect they would be dying sooner. Thus you can’t really do much with the above figures that mix all the age and smoking groups. I mean, sure, it’s a good idea to display them—it’s raw data, and indeed it did show the anomalous post-2000 pattern that got our attention in the first place—but it’s not so useful as a comparison.
Regarding age, the paper says “younger cohorts endorse LGB orientation at higher rates,” but the table in the paper clearly shows that the lesbians and bisexuals in the study are in the older cohorts in their data. So what’s up with that? Are the nurses an unusual group? Or perhaps there are some classification errors?
Here’s what I’d like to see: a repeat of the cumulative death probabilities in the top graph above, but as a 4 x 2 grid, showing results separately in each of the 4 age categories and for smokers and nonsmokers. Or maybe a 4 x 3 grid, breaking up the ever-smokers into heavy and light smokers. Yes, the data will be noisier, but let’s see what we’ve got here, no?
They also run some regressions adjusting for age cohort. That sounds like a good idea, although I’m a little bit concerned about variation within cohort for the older groups. Also, do they adjust for smoking? I don’t see that anywhere . . .
Ummmm, OK, I found it, right there on page 2, in the methods section:
We chose not to further control for other health-related variables that vary in distribution across sexual orientation (eg, diet, smoking, alcohol use) because these are likely on the mediating pathway between LGB orientation and mortality. Therefore, controlling for these variables would be inappropriate because they are not plausible causes of both sexual orientation and mortality (ie, confounders) and their inclusion in the model would likely attenuate disparities between sexual orientation and mortality. However, to determine whether disparities persisted above and beyond the leading cause of premature mortality (ie, smoking), we conducted sensitivity analyses among the subgroup of participants (n = 59 220) who reported never smoking between 1989 and 1995 (year when sexual orientation information was obtained).
And here’s what they found:
Among those who reported never smoking (n = 59 220), LGB women had earlier mortality than heterosexual women (acceleration factor for all LGB women, 0.77 [95% CI, 0.62-0.96]; acceleration factor for lesbian participants, 0.80 [95% CI, 0.61-1.05]; acceleration factor for bisexual participants, 0.72 [95% CI, 0.50-1.04]).
I don’t see this analysis anywhere in the paper. I guess they adjusted for age cohorts but not for year of age, but I can’t be sure. Also I think you’d want to also adjust for lifetime smoking level, not just between 1989 and 1995. I’d think the survey would also have asked about whether participants’ earlier smoking status, and I’d think that smoking would be asked in followups?
Putting it all together
The article and the supplementary information present a lot of estimates. None of them are quite what we want—that would be an analysis that adjusts for year of age as well as cohort, adjusts for smoking status, and also grapples in some way with the missing data.
But we can triangulate. For all the analyses, I’ll pool the lesbian and bisexual groups because the sample size within each of these two groups is too small to learn much about them separately. For each analysis, I’ll give the reported 95% adjusted acceleration factor as an estimate +/- margin of error:
Crude analysis, not adjusting for cohort: 0.71 +/- 0.10
Main analysis, adjusting for cohort: 0.74 +/- 0.10
Using only deaths before 2020, adjusting for cohort: 0.79 +/- 0.10
Imputing missing responses for sexual orientation, adjusting for cohort: 0.79 +/- 0.10
Using only the nonsmokers, maybe adjusting for cohort: 0.77 +/- 0.17
Roughly speaking, adjusting for cohort adds 0.03 to the acceleration factor, imputing missing responses adds 0.05, and adjusting for smoking adds 0.03 or 0.06. I don’t know what would happen if you add all three adjustments; given what we have here, my best guess would be to add 0.03 + 0.05 + (0.03 or 0.06) = 0.11 or 0.14, which would take the estimated acceleration factor to 0.82 or 0.85. Also, if we’re only going to take the nonsmokers, we’ll have to use the wider margin of error.
Would further adjustment do more? I’m not sure. I’d like to do more adjustment for age and for smoking status; that said, I have no clear sense what direction this would shift the estimate.
So our final estimate is 0.82 +/- 0.17 or 0.85 +/- 0.17, depending on whether or not their only-nonsmokers analysis adjusted for cohort. They’d get more statistical power by including the smokers and adjusting for smoking status, but, again, without the data here I can’t say how this would go, so we have to make use of what information we have.
This result is, or maybe is not, statistically significant at the conventional 95% level. That is not to say that there is no population difference, just that there’s uncertainty here, and I think the claims made in the research article are not fully supported by the evidence given there.
I have similar issues with the news reports of this study, for example this:
One possible explanation for the findings is that bisexual women experience more pressure to conceal their sexual orientation, McKetta said, noting that most bisexual women have male partners. “Concealment used to be thought of as sort of a protective mechanism … but [it] can really rot away at people’s psyches and that can lead to these internalizing problems that are also, of course, associated with adverse mental health,” she said.
Sure, it’s possible, but shouldn’t you also note that the observed differences could also be explained by missing-data issues, smoking status, and sampling variation?
And now . . . the data!
Are the data available for reanalysis? I’m not sure. The paper had this appendix:
I don’t like the requirement of “co-investigator approval” . . . what’s with that? Why they can’t just post the data online? Anyway, I followed the link and filled out the form to request the data, so we’ll see what happens. I needed to give a proposal title so I wrote, “Reanalysis of Disparities in Mortality by Sexual Orientation in a Cohort of Female Nurses.” I also had to say something about the scientific significance of my study, for which I wrote, “The paper, Disparities in Mortality by Sexual Orientation in a Cohort of Female Nurses, received some attention, and it would be interesting to see how the results in that paper vary by age and smoking status.” For my “Statement of Hypothesis and Specific Aims,” I wrote, “I have no hypotheses. My aim is to see how the results in that paper vary by age and smoking status.” . . .
Ummmm . . . I was all ready to click Submit—I’d filled out the 6-page form, and then this:

A minimum of $7800 per year per cohort?? What the hell???
To be clear, I don’t think this is the fault of the authors of the above-discussed paper. It just seems to be the general policy of the Nurses Health Study.
Summary
I don’t think it’s bad that this paper was published. It’s pretty much free to root around at available datasets and see what you can find. (OK, in this case, it’s not free, it’s actually a minimum of $7800 per year per cohort, but this isn’t a real cost; it’s just a transfer payment: the researchers get an NIH grant, some of which is spent on . . . some earlier recipient of an NIH grant.) The authors didn’t do a perfect statistical analysis, but no statistical analysis is perfect; there are always ways to improve. The data have problems (as shown in the graph at the top of this post), but there was enough background in the paper for us to kind of figure out where the problem lay. And they did a few extra analyses—not everything I’d like to see, but some reasonable things.
So what went wrong?
I hate to say it because regular readers have heard it all before, but . . . forking paths. Researcher degrees of freedom. As noted above, my best guess of a reasonable analysis would yield an estimate that’s about two standard errors away from zero. But other things could’ve been done.
And the authors got to decide what result to foreground. For example, their main analysis didn’t adjust for smoking. But what if smoking had gone the other way in the dataset, so that the lesbians and bisexuals in the data had been less likely to smoke? Then a lack of adjustment would’ve diminished the estimated effect, and the authors might well have chosen the adjusted analysis as their primary result. Similarly with exclusion of the problematic data after 2020 and the missing data on sexual orientation. And lots of other analyses could’ve been done here, for example adjusting for ethnicity (they did do separate analyses for each ethnic group, but it was hard to interpret those results because they were so noisy), adjusting for year of age, and adjusting more fully for past smoking. I have no idea how these various analyses would’ve gone; the point is that the authors had lots of analyses to choose from, and the one they chose gave a big estimate in part because a lack of adjustment for some data problems.
What should be done in this sort of situation? Make the data available, for sure. (Sorry, Nurses Health Study, no $7800 per year per cohort for you.) Do the full analysis or, if you’re gonna try different things, try all of them or put them in some logical order; don’t just pick one analysis and then perturb it one factor at a time. And, if you’re gonna speculate, fine, but then also speculate about less dramatic explanations of your findings, such as data problems and sampling variation.
It should be no embarrassment that it’s hard to find any clear patterns in these data, as all of it is driven by a mere 81 deaths. n = 81 ain’t a lot. I’d say I’m kinda surprised that JAMA published this paper, but I don’t really know what JAMA publishes. It’s not a horrible piece of work, just overstated to the extent that the result is more of an intriguing pattern in a particular dataset rather than strong evidence of a general pattern. This often happens in the social sciences.
Also, the graphs. Those cumulative mortality graphs above are fine as data summaries—almost. First, it would’ve been good if the authors had noticed the problem post-2020. Second, the dramatic gap between the lines is misleading in that it does not account for the differences in average age and smoking status of the groups. As noted above, this could be (partly) fixed by replacing with a grid of graphs broken down by cohort and smoking status.
All of the above is an example of what can be learned from post-publication review. Only a limited amount can be learned without access to the data; it’s interesting to see what we can figure out from the indirect evidence available.